

Linkage mapping bovine EST-based SNP
- PMID: 15943875
- PMCID: PMC1166549
- DOI: 10.1186/1471-2164-6-74
Linkage mapping bovine EST-based SNP
Abstract
Background: Existing linkage maps of the bovine genome primarily contain anonymous microsatellite markers. These maps have proved valuable for mapping quantitative trait loci (QTL) to broad regions of the genome, but more closely spaced markers are needed to fine-map QTL, and markers associated with genes and annotated sequence are needed to identify genes and sequence variation that may explain QTL.
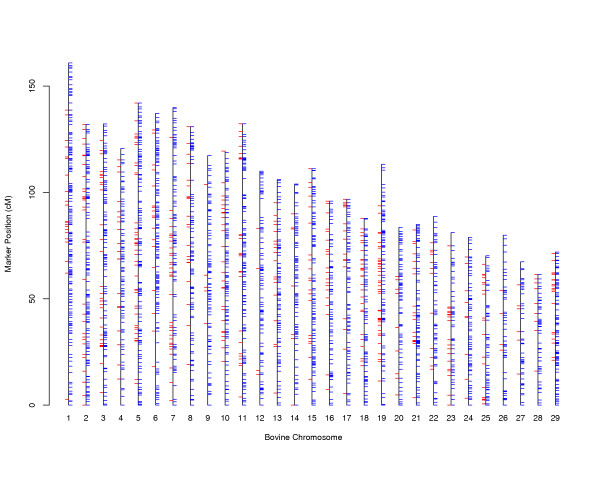
Results: Bovine expressed sequence tag (EST) and bacterial artificial chromosome (BAC)sequence data were used to develop 918 single nucleotide polymorphism (SNP) markers to map genes on the bovine linkage map. DNA of sires from the MARC reference population was used to detect SNPs, and progeny and mates of heterozygous sires were genotyped. Chromosome assignments for 861 SNPs were determined by twopoint analysis, and positions for 735 SNPs were established by multipoint analyses. Linkage maps of bovine autosomes with these SNPs represent 4585 markers in 2475 positions spanning 3058 cM. Markers include 3612 microsatellites, 913 SNPs and 60 other markers. Mean separation between marker positions is 1.2 cM. New SNP markers appear in 511 positions, with mean separation of 4.7 cM. Multi-allelic markers, mostly microsatellites, had a mean (maximum) of 216 (366) informative meioses, and a mean 3-lod confidence interval of 3.6 cM Bi-allelic markers, including SNP and other marker types, had a mean (maximum) of 55 (191) informative meioses, and were placed within a mean 8.5 cM 3-lod confidence interval. Homologous human sequences were identified for 1159 markers, including 582 newly developed and mapped SNP.
Conclusion: Addition of these EST- and BAC-based SNPs to the bovine linkage map not only increases marker density, but provides connections to gene-rich physical maps, including annotated human sequence. The map provides a resource for fine-mapping quantitative trait loci and identification of positional candidate genes, and can be integrated with other data to guide and refine assembly of bovine genome sequence. Even after the bovine genome is completely sequenced, the map will continue to be a useful tool to link observable phenotypes and animal genotypes to underlying genes and molecular mechanisms influencing economically important beef and dairy traits.
Figures
Similar articles
-
A gene-based high-resolution comparative radiation hybrid map as a framework for genome sequence assembly of a bovine chromosome 6 region associated with QTL for growth, body composition, and milk performance traits.BMC Genomics. 2006 Mar 16;7:53. doi: 10.1186/1471-2164-7-53. BMC Genomics. 2006. PMID: 16542434 Free PMC article.
-
Construction of a dense SNP map for bovine chromosome 6 to assist the assembly of the bovine genome sequence.Anim Genet. 2008 Apr;39(2):97-104. doi: 10.1111/j.1365-2052.2007.01686.x. Epub 2008 Feb 26. Anim Genet. 2008. PMID: 18307581
-
Development of a dense SNP-based linkage map of an apple rootstock progeny using the Malus Infinium whole genome genotyping array.BMC Genomics. 2012 May 25;13:203. doi: 10.1186/1471-2164-13-203. BMC Genomics. 2012. PMID: 22631220 Free PMC article.
-
QTL mapping using high-throughput sequencing.Methods Mol Biol. 2015;1284:257-85. doi: 10.1007/978-1-4939-2444-8_13. Methods Mol Biol. 2015. PMID: 25757777 Review.
-
A comprehensive map of the porcine genome.Genome Res. 1996 May;6(5):371-91. doi: 10.1101/gr.6.5.371. Genome Res. 1996. PMID: 8743988 Review.
Cited by
-
A gene-based high-resolution comparative radiation hybrid map as a framework for genome sequence assembly of a bovine chromosome 6 region associated with QTL for growth, body composition, and milk performance traits.BMC Genomics. 2006 Mar 16;7:53. doi: 10.1186/1471-2164-7-53. BMC Genomics. 2006. PMID: 16542434 Free PMC article.
-
Identification of a two-marker-haplotype on Bos taurus autosome 18 associated with somatic cell score in German Holstein cattle.BMC Genet. 2009 Sep 2;10:50. doi: 10.1186/1471-2156-10-50. BMC Genet. 2009. PMID: 19725965 Free PMC article.
-
A first-generation metric linkage disequilibrium map of bovine chromosome 6.Genetics. 2006 Sep;174(1):79-85. doi: 10.1534/genetics.106.060418. Epub 2006 Jul 2. Genetics. 2006. PMID: 16816421 Free PMC article.
-
Biomarker discovery in animal health and disease: the application of post-genomic technologies.Biomark Insights. 2007 Jul 10;2:185-96. Biomark Insights. 2007. PMID: 19662203 Free PMC article.
-
Assignment of chromosomal locations for unassigned SNPs/scaffolds based on pair-wise linkage disequilibrium estimates.BMC Bioinformatics. 2010 Apr 7;11:171. doi: 10.1186/1471-2105-11-171. BMC Bioinformatics. 2010. PMID: 20370931 Free PMC article.
References
-
- Casas E, Shackelford SD, Keele JW, Koohmaraie M, Smith TP, Stone RT. Detection of quantitative trait loci for growth and carcass composition in cattle. J Anim Sci. 2003;81:2976–2983. - PubMed
-
- Ashwell MS, Heyen DW, Sonstegard TS, Van Tassell CP, Da Y, VanRaden PM, Ron M, Weller JI, Lewin HA. Detection of quantitative trait loci affecting milk production, health, and reproductive traits in Holstein cattle. J Dairy Sci. 2004;87:468–475. - PubMed
-
- Barendse W, Vaiman D, Kemp SJ, Sugimoto Y, Armitage SM, Williams JL, Sun HS, Eggen A, Agaba M, Aleyasin SA, Band M, Bishop MD, Buitkamp J, Byrne K, Collins F, Cooper L, Coppettiers W, Denys B, Drinkwater RD, Easterday K, Elduque C, Ennis S, Erhardt G, Ferretti L, Flavin N, Gao Q, Georges M, Gurung R, Harlizius B, Hawkins G, Hetzel J, Hirano T, Hulme D, Jorgensen C, Kessler M, Kirkpatrick BW, Konfortov B, Kostia S, Kuhn C, Lenstra JA, Leveziel H, Lewin HA, Leyhe B, Li L, Martin Burriel I, McGraw RA, Miller JR, Moody DE, Moore SS, Nakane S, Nijman IJ, Olsaker I, Pomp D, Rando A, Ron M, Shalom A, Teale AJ, Thieven U, Urquhart BGD, Vage DI, Van de Weghe A, Varvio S, Velmala R, Vilkki J, Weikard R, Woodside C, Womack JE. A medium-density genetic linkage map of the bovine genome. Mamm Genome. 1997;8:21–28. doi: 10.1007/s003359900340. - DOI - PubMed
-
- Kappes SM, Keele JW, Stone RT, McGraw RA, Sonstegard TS, Smith TP, Lopez-Corrales NL, Beattie CW. A second-generation linkage map of the bovine genome. Genome Res. 1997;7:235–249. - PubMed
-
- Ihara N, Takasuga A, Mizoshita K, Takeda H, Sugimoto M, Mizoguchi Y, Hirano T, Itoh T, Watanabe T, Reed KM, Snelling WM, Kappes SM, Beattie CW, Bennett GL, Sugimoto Y. A comprehensive genetic map of the cattle genome based on 3802 microsatellites. Genome Res. 2004;14:1987–1998. doi: 10.1101/gr.2741704. - DOI - PMC - PubMed
MeSH terms
Substances
LinkOut - more resources
Full Text Sources
Other Literature Sources
Research Materials
