. 2005 Nov;94(5):3259-77.
doi: 10.1152/jn.00481.2005. Epub 2005 Jun 8.

Temperature compensation of neuromuscular modulation in aplysia

Affiliations

Temperature compensation of neuromuscular modulation in aplysia

Yuriy Zhurov et al. J Neurophysiol. 2005 Nov.

Abstract

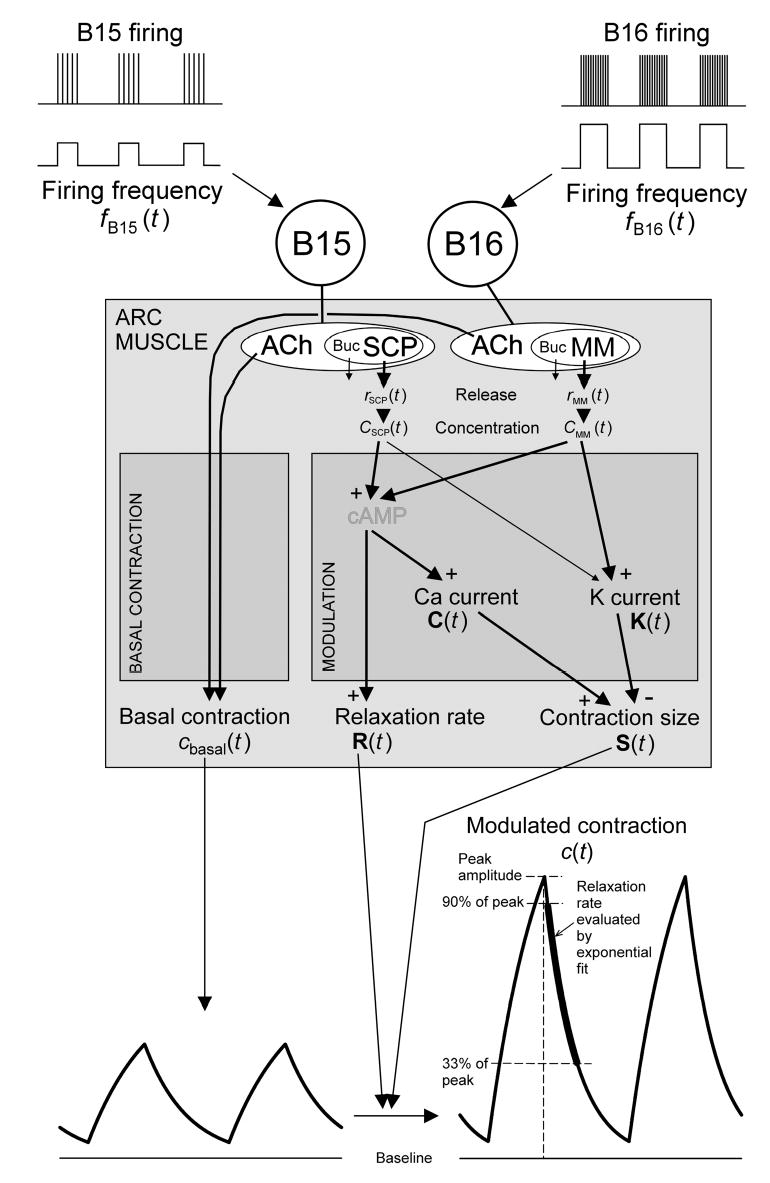
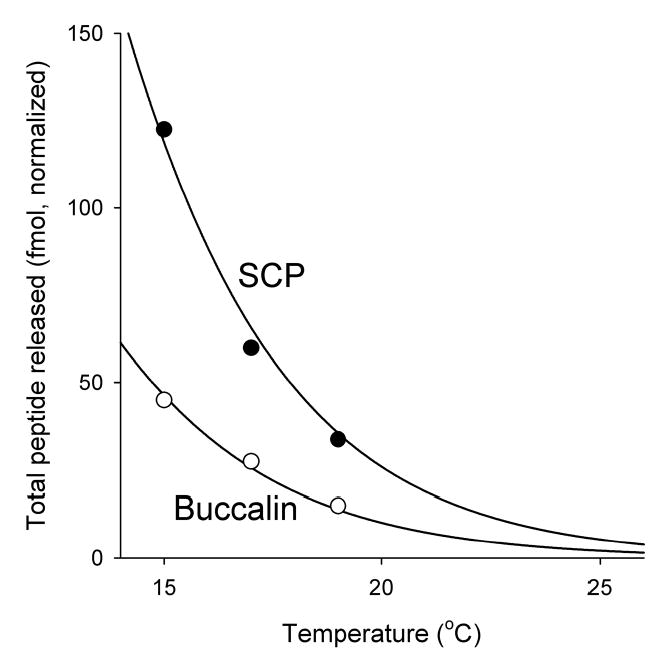
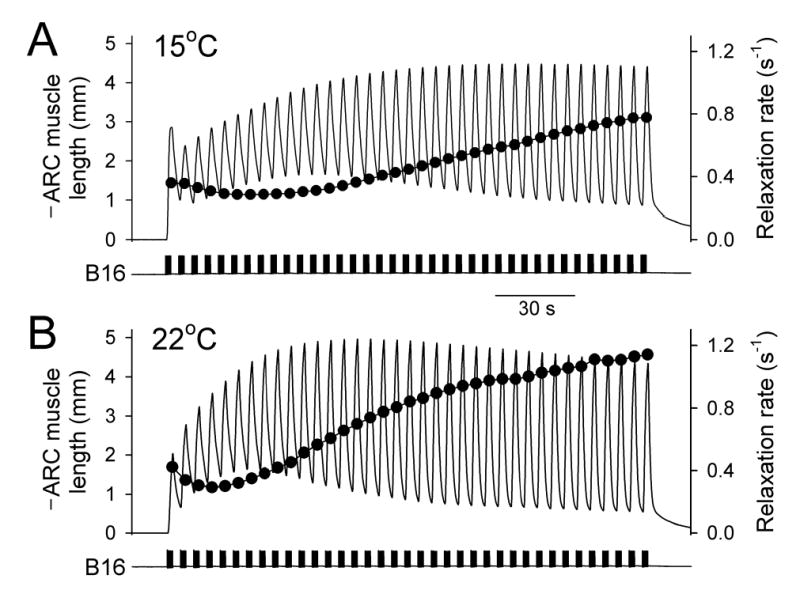
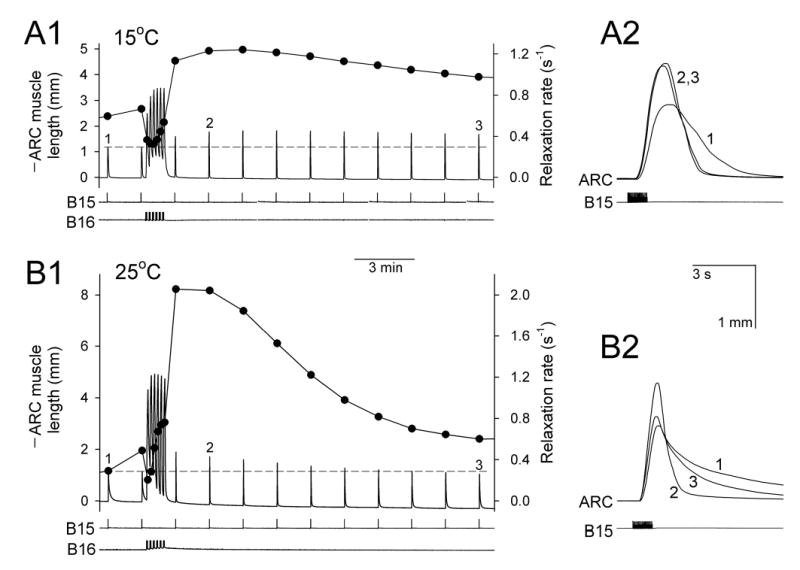
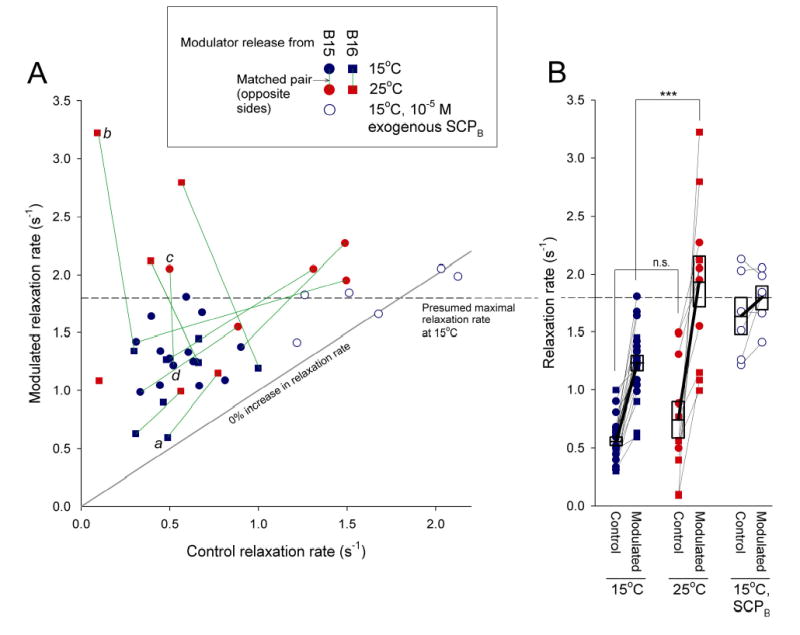
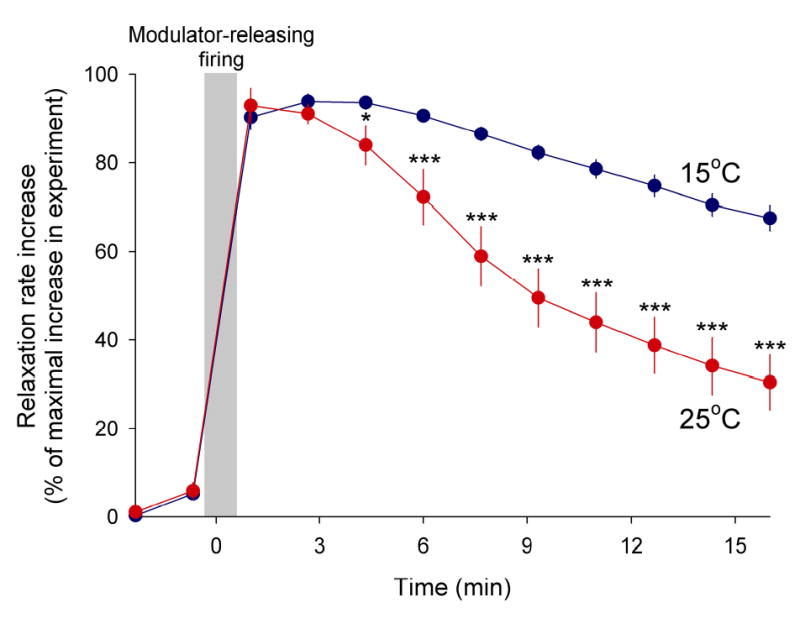
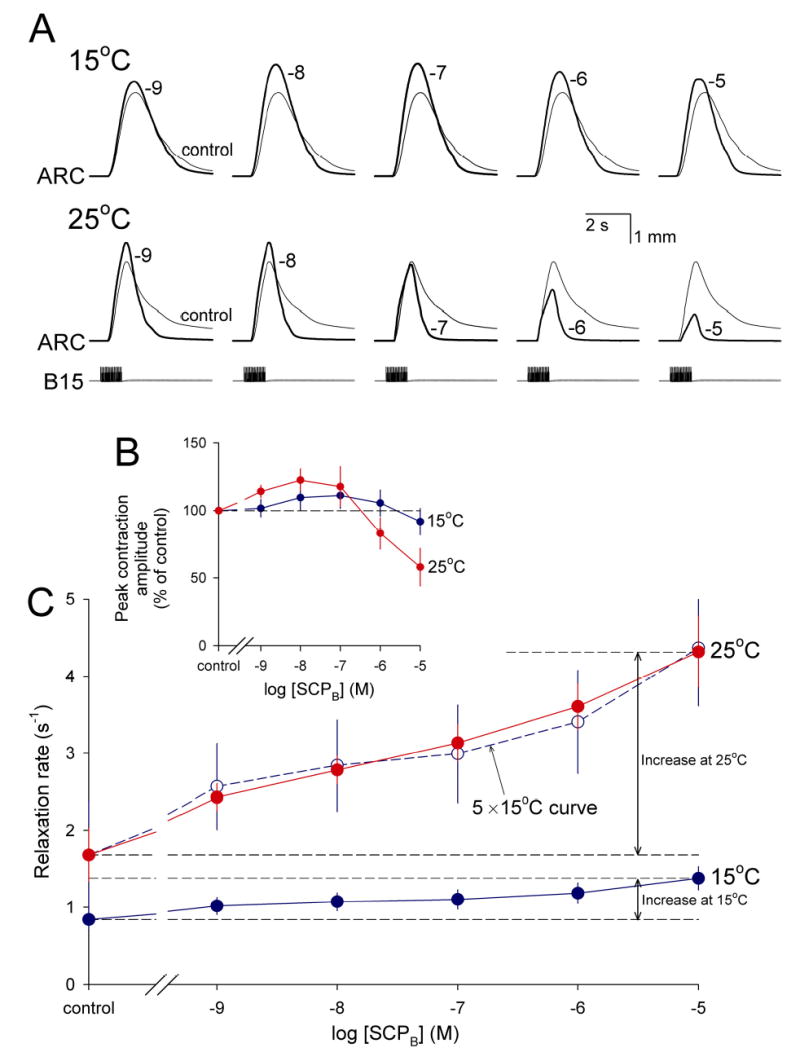
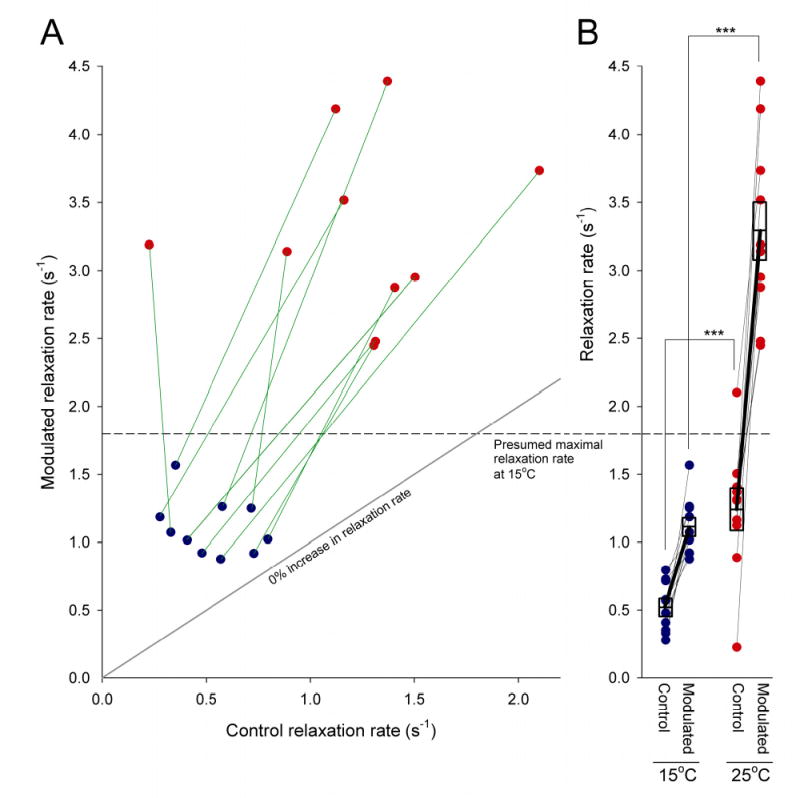
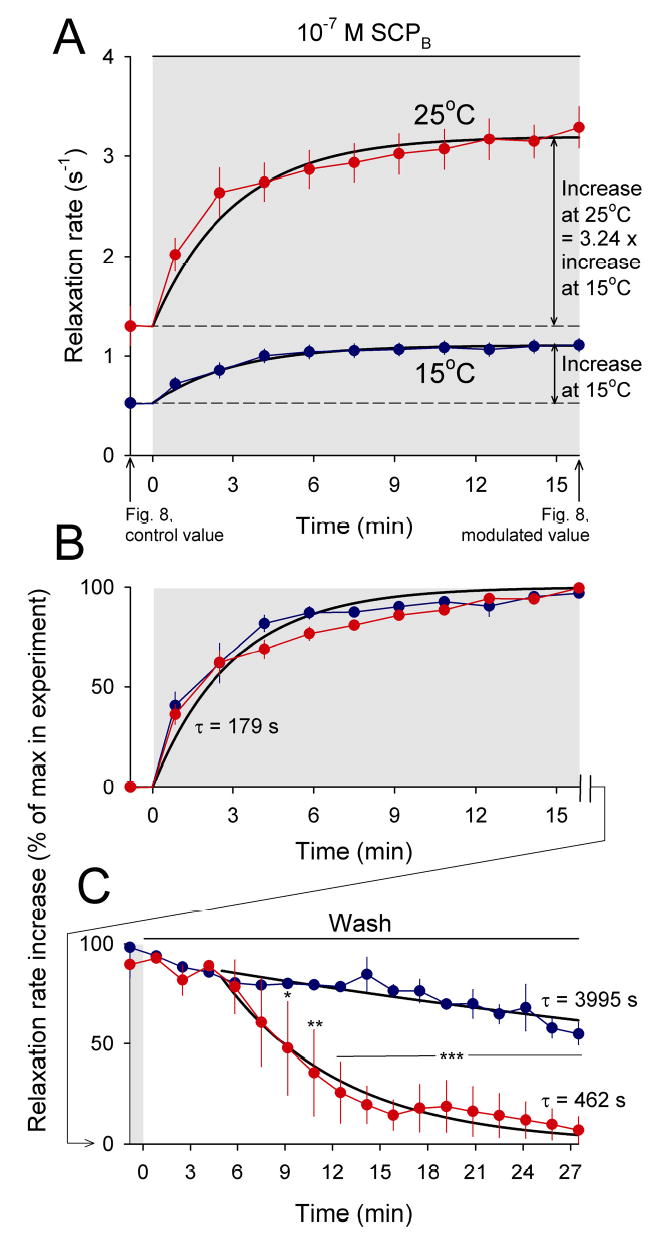
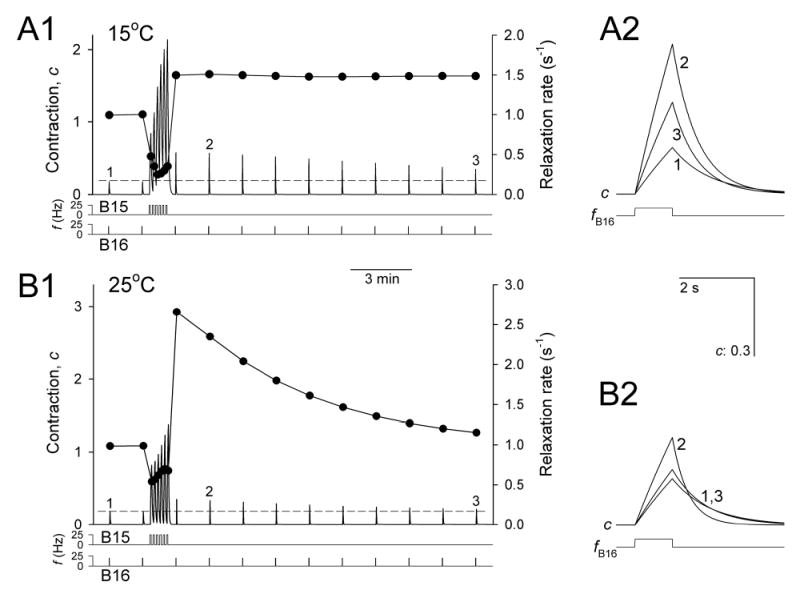
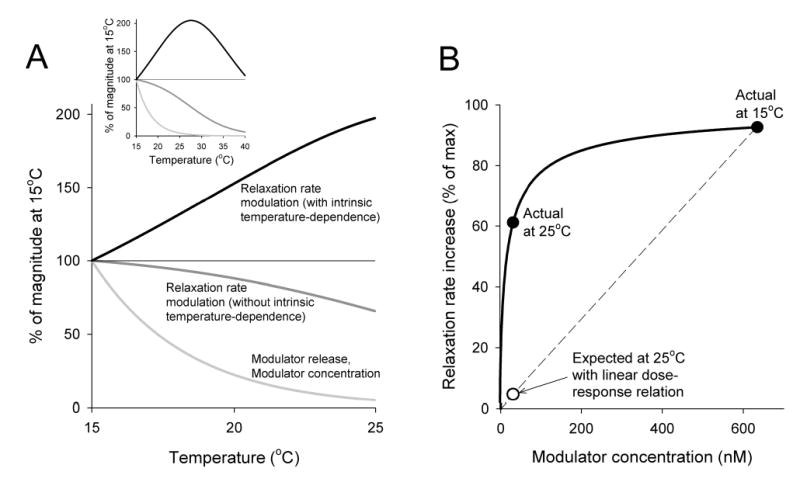
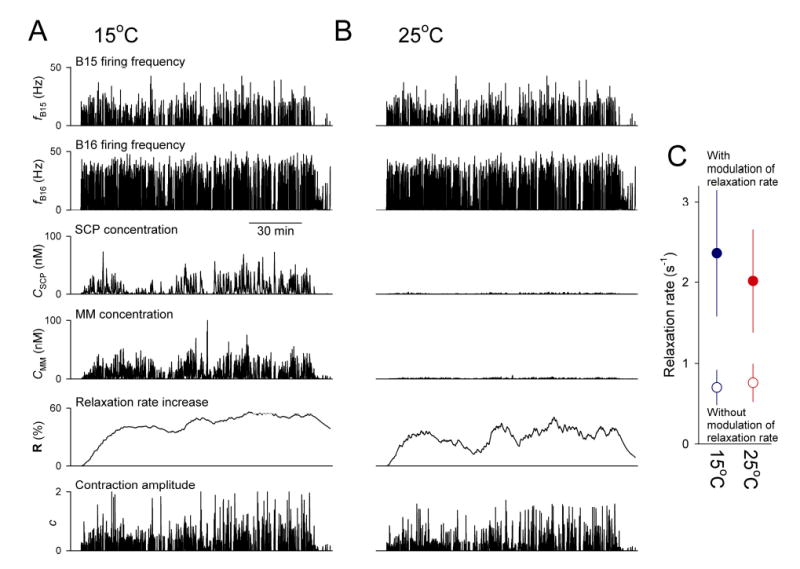
Physiological systems that must operate over a range of temperatures often incorporate temperature-compensatory mechanisms to maintain their output within a relatively narrow, functional range of values. We analyze here an example in the accessory radula closer (ARC) neuromuscular system, a representative part of the feeding neuromusculature of the sea slug Aplysia. The ARC muscle's two motor neurons, B15 and B16, release, in addition to ACh that contracts the muscle, modulatory peptide cotransmitters that, through a complex network of effects in the muscle, shape the ACh-induced contractions. It is believed that this modulation is critical in optimizing the performance of the muscle for successful, efficient feeding behavior. However, previous work has shown that the release of the modulatory peptides from the motor neurons decreases dramatically with increasing temperature. From 15 to 25 degrees C, for example, release decreases 20-fold. Yet Aplysia live and feed successfully not only at 15 degrees C, but at 25 degrees C and probably at higher temperatures. Here, working with reduced B15/B16-ARC preparations in vitro as well as a mathematical model of the system, we have found a resolution of this apparent paradox. Although modulator release decreases 20-fold when the temperature is raised from 15 to 25 degrees C, the observed modulation of contraction shape does not decrease at all. Two mechanisms are responsible. First, further downstream within the modulatory network, the modulatory effects themselves-experimentally dissected by exogenous modulator application-have temperature dependencies opposite to that of modulator release, increasing with temperature. Second, the saturating curvature of the dose-response relations within the network diminishes the downstream impact of the decrease of modulator release. Thus two quite distinct mechanisms, one depending on the characteristics of the individual components of the network and the other emerging from the network's structure, combine to compensate for temperature changes to maintain the output of this physiological system.


Figures

Figure 1
Figure 1
Schematic summary of the structure of the B15/B16-ARC neuromuscular system. The variables X(t) are the variables of the dynamical model of the system from Brezina et al. (2003a,b) that we use here in Figs. 2 and 10–12. For details see Introduction, Methods, and Reproduction of the observed temperature-dependence in a mathematical model of the system in Results.
Figure 2
Figure 2
Temperature-dependence of modulatory peptide cotransmitter release from motor neuron B15. The points replot the experimental data from Fig. 6B of Vilim et al. (1996a). Vilim et al. used radioimmunoassay to directly measure the total amounts of SCP (filled points) and buccalin (open points) appearing in the perfusate of the ARC muscle when motor neuron B15 was intracellularly stimulated to fire in a physiologically realistic bursting pattern, with intraburst firing frequency fintra = 12 Hz, burst duration dintra = 3.5 s, and interburst interval dinter = 3.5 s, for a total length of firing L = 10 min, at 15ºC, 17ºC, and 19ºC. Each point is a mean of n = 4 preparations, with SE smaller than the mean symbol size, normalized however within each preparation as follows. Because different preparations can release quite different absolute amounts of peptides (Vilim et al. 1996a,b; Brezina et al. 2000a), Vilim et al. expressed all of the data as percent of the grand total amount of peptide released in the entire series of repetitions of the motor neuron firing pattern at the three temperatures within each preparation. Here we have simply rescaled the plot of Vilim et al. to absolute peptide amounts by multiplying each percentage by the mean grand total amount of peptide released in the 4 preparations (F.S. Vilim, personal communication). Thus the small errors seen here reflect just the variance of the effect of temperature; the much larger variance between preparations has been normalized out. The continuous curves are best fits of our model of the release process (Brezina et al. 2000a, 2003a). To model the temperature-dependence, we use the standard concept of the temperature coefficient, Q10, relating the value of variable X at temperature T to its value at 15ºC by X(T)=X(15°C)Q10(T-15)/10. With such a coefficient, Q10,r, incorporated into the release equations to scale the instantaneous release, r (see Brezina et al. 2003a, Eq. 7 in Fig. 11 legend below), analysis of the model (see Brezina et al. 2000a, nalysis of Model II) shows that R, the total amount of peptide released by the entire block of firing of length L, as measured in these experiments by Vilim et al., is described by the equation (the equivalent of Eq. 15 of Brezina et al. 2000a) R(L)=S0(1-exp{-Q10,r(T-15)/10pΦfy[L-τp+τp   exp(-L/τp)]}), where S0 is the initial size of the releasable peptide pool, p=fkp+/kp- and τp = 1/kp are respectively the steady-state value and the time constant of a slow reaction governing the probability of release, Φ= D1−y is the pattern-dependence of the release, D = dintra/(dintra + dinter) is the duty cycle of the firing pattern, and f=fintraD is the mean firing frequency, with the parameter values [determined from other data of Vilim et al. (1996a,b) by Brezina et al. (2000a, 2003a)] kp+ = 4.0 × 10⁻¹⁰, kp = 3.4 × 10⁻³ s−1, y = 3, and fintra, dintra, and dinter as above. This leaves just Q10,r, S0,SCP, and S0,Buc as free parameters. Fitting Eq. 2 simultaneously to both the SCP and buccalin data yielded Q10,r = 5.05 × 10⁻² (≈1/20), S0,SCP = 628 fmol, and S0,Buc = 245 fmol, and the curves shown. [The value of S0,SCP found here is 16% larger, and the value of S0,Buc is 24% larger, than the concensus values of 541 and 198 fmol that were determined by Brezina et al. (2000a), presumably again because the different preparations used released different absolute amounts of peptides.]
Figure 3
Figure 3
Single motor neuron self-modulation: representative experiment. Motor neuron B16 was fired at 13 Hz for 2 s every 5 s for 3 min, at 15ºC (A) and ~22ºC (B). The continuous waveform in each case is the instantaneous length of the ARC muscle relative to the baseline length at the beginning of the motor neuron firing (axis at left; decreasing length, hence increasing contraction amplitude, is plotted upward); the large black points are measurements of the relaxation rate of the contraction elicited by each motor neuron burst (axis at right; see Fig. 1 and Methods). Left and right ARC muscles of the same preparation.
Figure 4
Figure 4
Two motor neuron cross-modulation: representative experiment. Motor neuron B15 was fired at 25 Hz for 1 s every 100 s to elicit monitoring contractions, motor neuron B16 at 25 Hz for 4 s every 10 s for 60 s to release modulators, at 15ºC (A) and 25ºC (B). The continuous waveform in each of A1 and B1 is the instantaneous length of the ARC muscle (axis at left), the large black points are measurements of the relaxation rate of each contraction (axis at right). A2 and B2 expand the contractions 1–3 from A1 and B1. Left and right ARC muscles of the same preparation.
Figure 5
Figure 5
Two motor neuron cross-modulation: summary of measurements of the modulation of relaxation rate. A: the modulated relaxation rate, of the monitoring contraction ~2 min after the end of the modulator-releasing firing (i.e., contraction 2 in Fig. 4), is plotted against the control relaxation rate, of the monitoring contraction before the modulator-releasing firing (contraction 1 in Fig. 4). Motor neuron B16 was fired to elicit the monitoring contractions and motor neuron B15 to release the modulators, at 15ºC (filled blue circles, n = 15) or 25ºC (red circles, n = 5), or, conversely, B15 was fired to elicit the monitoring contractions and B16 to release the modulators, at 15ºC (blue squares, n = 8) or 25ºC (red squares, n = 6). The green lines join matched pairs of measurements, at 15ºC and 25ºC, in the two ARC muscles of the same preparation. The open blue circles are measurements from experiments in which motor neuron B16 was fired to elicit the monitoring contractions and motor neuron B15 to release the modulators, at 15ºC, but in the presence of 10−5 M exogenous SCPB (n = 6). B: the same measurements of control and modulated relaxation rate as in A plotted along one dimension for statistical comparison. The same symbols are used as in A; the motor neurons B15 and B16 are pooled. The box in each column indicates the mean ± SE. The thin black lines join the corresponding control and modulated values that are plotted against each other in A; the thick black lines join the means. Statistical significance was tested with two-way ANOVA followed by pairwise multiple comparisons using the Holm-Sidak test. Comparing the control with the modulated mean under each of the three conditions, there were highly significant differences (p < 0.001) at 15ºC and at 25ºC, but no significant difference (p > 0.05) at 15ºC in the presence of exogenous SCPB. Comparing between conditions, there was no significant difference between the control means (p > 0.05, “n.s.”), but a highly significant difference between the modulated means (p < 0.001, “***”), at 15ºC and 25ºC. For further explanation see Quantification of the modulation of relaxation rate in Results.
Figure 6
Figure 6
Two motor neuron cross-modulation: reversal of the modulation of relaxation rate. In each of the experiments in Fig. 5 (without exogenous SCP), the time series of the relaxation rates measured from each of the monitoring contractions from before the modulator-releasing firing to ~16 min after it (i.e., the span shown in Fig. 4, A1 and B1) was normalized to between 0% and 100%, the smallest and largest values measured in that particular experiment. Plotted here are the means ± SE of the normalized time series at 15ºC (blue; n = 23) and 25ºC (red; n = 11). Statistical significance was tested with two-way ANOVA followed by pairwise multiple comparisons using the Holm-Sidak test. The overall difference between the 15ºC and 25ºC conditions was highly significant (p < 0.001); *** then indicates p < 0.001, and *, p < 0.05, for the difference between the 15ºC and 25ºC means at a particular timepoint.
Figure 7
Figure 7
Modulation by exogenous modulator: dose-response relations for exogenous SCPB. Motor neuron B15 was fired at 20 Hz for 1 s every 100 s to elicit monitoring contractions while increasing concentrations of SCPB were applied to the ARC muscle. The concentrations were applied cumulatively, without intervening wash; each concentration was allowed to work for at least 8 min before the parameters of the final contraction were measured. Five preparations were used, with one of the muscles in each preparation tested at 15ºC and the other at 25ºC, but for statistical purposes they are here treated as independent experiments. A: representative contractions at 15ºC and 25ºC, in the two muscles of the same preparation. Shown are the final contractions at 10−9, 10−8, 10−7, 10−6, and 10−5 M SCPB (“−9” … “−5”), all superimposed on the same control contraction for comparison. For simplicity, only the motor neuron B15 burst that elicited the control contraction, at 25ºC, is shown in each case. B: mean ± SE of the peak contraction amplitude, normalized to the peak amplitude of the control contraction in each muscle, as a function of the SCPB concentration, at 15ºC (blue; n = 5) and 25ºC (red; n = 5). C: mean ± SE of the relaxation rate as a function of the SCPB concentration, at 15ºC (solid blue; n = 5) and 25ºC (red; n = 5). The dashed blue curve is the 15ºC dose-response relation projected into the range spanned by the 25ºC dose-response relation and multiplied by 5. For further explanation see Modulation of the relaxation rate by exogenous modulator is intrinsically stronger at higher temperature in Results.
Figure 8
Figure 8
Modulation by exogenous modulator: magnitude of the modulation of relaxation rate by 10−7 M SCPB. Figure constructed along the lines of Fig. 5. A: the modulated relaxation rate, of the final monitoring contraction elicited by motor neuron B15 after the SCPB had been applied to the muscle and the modulation had fully developed (>16 min after the SCPB application: see Fig. 9A), is plotted against the control relaxation rate. The green lines join matched pairs of measurements, made in the same muscle at 15ºC (blue circle; n = 10) and 25ºC (red circle; n = 10) (tested in either order in different muscles) with two applications of SCPB separated by wash. B: the same measurements of control and modulated relaxation rate as in A plotted along one dimension for statistical comparison. Statistical significance was tested with two-way ANOVA followed by pairwise multiple comparisons using the Holm-Sidak test. There were highly significant differences (p < 0.001) between the control and modulated means at each temperature as well as between temperatures (“***”).
Figure 9
Figure 9
Modulation by exogenous modulator: time course of the modulation of relaxation rate by 10−7 M SCPB. A: unnormalized time course of the development of the modulation. Means ± SE of the absolute relaxation rates of successive monitoring contractions elicited by motor neuron B15 before and during the application of SCPB (grey block), at 15ºC (blue, n =10) and 25ºC (red, n = 10). The labels “Fig. 8, control value” and “Fig. 8, modulated value” indicate where the measurements were taken for Fig. 8. The solid black curves are the best single-exponential fits, constrained in each case to have the time constant τ = 179 s obtained from B, to the data at the two temperatures, yielding the magnitudes of the fully developed modulation, 3.24-fold larger at 25ºC than at 15ºC. B: normalized time course of the development of the modulation. Same data as in A but first normalized to between 0% and 100%, the smallest and largest values measured within each experiment, as in Fig. 6. Tested with two-way ANOVA, the overall difference between the 15ºC and 25ºC conditions was not significant (p > 0.05). The solid black curve is the best single-exponential fit simultaneously to the data at both temperatures, with τ = 179 s. C: normalized time course of the reversal of the modulation upon washout of the SCPB. Means ± SE of the relaxation rates of monitoring contractions continued after the end of those measured in A and B in a subset of those experiments (n = 3 each at 15ºC and 25ºC), normalized as in B. Statistical significance was tested with two-way ANOVA followed by pairwise multiple comparisons using the Holm-Sidak test. The overall difference between the 15ºC and 25ºC conditions was highly significant (p < 0.001); *** then indicates p < 0.001, **, p < 0.01, and *, p < 0.05, for the difference between the 15ºC and 25ºC means at a particular timepoint. The solid black curves are the best single-exponential fits, over the range of times indicated, to the data at the two temperatures, with τ = 3,995 s at 15° C and τ = 462 s at 25° C.
Figure 10
Figure 10
Two motor neuron cross-modulation reproduced with a mathematical model incorporating temperature-dependence. Here an experiment like that in Fig. 4 was simulated, with motor neuron B16 fired to elicit the monitoring contractions and motor neuron B15 to release the modulator (SCP). f, firing frequency; c, contraction (dimensionless). The model was taken from Brezina et al. (2003a,b) and used without modification except for the incorporation of temperature-dependence for two of its steps. The intrinsic temperature-dependence of modulator release was modeled from the experimental data in Fig. 2 as described in Fig. 2 legend. The intrinsic temperature-dependence of the modulation of the relaxation rate was modeled from the data in Figs. 7–9 as follows. In the model the modulator-induced increase in relaxation rate is described by the variable R (Fig. 1), which ranges from 0 to a maximal value, Rmax (Brezina et al. 2003a). R is then converted to an increase in the absolute relaxation rate of the muscle, in units of s−1, through a coupling factor δR (see Eq. 1h of Brezina et al. 2003b; here δR = 0.05). The dynamics of R, when controlled by a single modulator such as SCP, are governed by the first-order differential equation dR(t)dt=kR+CSCP(t)[Rmax-R(t)]-kR-R(t) where CSCPCSCPhR is the concentration of SCP, CSCP, modified by the Hill coefficient hR = 0.7, kR+ and kR are rate constants, and t is time. After a step at t = 0 to a new, maintained CSCP(t ≥ 0) [with an intrinsic time constant of <30 s (Brezina et al. 2003a), the step in CSCP can be considered quasi-instantaneous on the time scale of the experiments in Fig. 9], Eq. 3 predicts a single-exponential rise (or fall) in R, R(t)=R-[R-R(t-0)]exp(-t/τR), with steady-state value R=CSCPRmaxCSCP+KR, where KRkR /kR+, and time constant τR=1kR+CSCP+kR- (see Eqs. 5 of Brezina et al. 2003a). To preserve the shape of the steady-state dose-response relation (Eq. 5) as modeled by Brezina et al. (2003a), furthermore apparently at all temperatures (Fig. 7C), the value KR = 3.64 ×10⁻⁶ MhRof Brezina et al. (2003a) must be preserved at all temperatures. This restricts the choice of kR+ and kR and requires both to have the same temperature coefficient, Q10,kR. When CSCP(t ≥ 0) = 0, as in Fig. 9C, Eq. 6 yields τR = 1/kR. Thus the values of kR at 15ºC and 25ºC, and so Q10,kR as well as, through the relationship KR = kR/kR+ = 3.64×10⁻⁶ M hR, the corresponding values of kR+, can in principle be immediately obtained from the time constants of the fitted exponentials in Fig. 9C. The ratio of these time constants implies Q10,kR ≈ 8.6. However, the absolute values of the time constants are not entirely consistent with some of the previous values compiled by Brezina et al. (2003a), and in general not all of the available data can be completely accommodated within the simplifying framework of Eqs. 4–6 as discussed by Brezina et al. (2003a). We therefore selected a concensus set of values of kR+, kR, and Q10,kR that appeared to represent the best compromise between the previous data of Brezina et al. (2003a) and the time constants in Fig. 9C, as well as Fig. 9, A and B, here. We set kR+ (15ºC) = 152.5 s−1 M hR, kR(15ºC) = 5.55 × 10⁻⁴ s−1 (so that, still, KR = 3.64×10⁻⁶ MhR), and, conservatively, Q10,kR = 5. Finally, the temperature-dependent scaling of the magnitude of the modulation seen in Figs. 7C and 9A requires an additional temperature coefficient of Rmax,Q10, Rmax. Fig. 7C suggests Q10, Rmax ≈ 5 and Fig. 9A Q10, Rmax ≈ 3.2; we set, conservatively, Q10, Rmax = 3, with Rmax(15ºC) = 100%.
Figure 11
Figure 11
Second, structural mechanism of temperature compensation: analysis with the model. A: cumulative steady-state temperature-dependence at successive levels in the sequence Motor neuron firing → Modulator release → Modulator concentration → Relaxation rate modulation, illustrated with motor neuron B15 and SCP. (Motor neuron B16 and MM would present a qualitatively identical picture, although quantitatively the curves would be slightly different.) With input firing of motor neuron B15 at a steady frequency fB15 = 10 Hz, the model was solved analytically for the steady states of rSCP, CSCP, and R, the relevant successive variables in the sequence (Fig. 1). These steady states are given by the equations [taken from Brezina et al. (2003a) or derived from the master dynamical equations therein] rSCP,=Q10,r(T-15)/10S0,SCPpfB15y, [SSCP, the size of the releasable pool of SCP, was fixed at the initial size S0,SCP to eliminate the progressive depletion of the pool which would otherwise prevent the system from reaching any nonzero steady state (Brezina et al. 2003a)], CSCP,=rSCP,/vkC,SCP, where ν = 10 μl is the effective volume into which the SCP is released and kC,SCP = 0.1 s−1 is the rate constant of SCP removal from ν, and either R=CSCP,RmaxCSCP,+KR, without any intrinsic temperature-dependence, or R=Q10,Rmax(T-15)/10CSCP,RmaxCSCP,+KR, incorporating the intrinsic temperature-dependence of R that was modeled in Fig. 10 legend. (Variables and parameters not defined here have already been introduced, and the specific parameter values used here have been given, in Fig. 2 and 10 legends.) Eqs. 7–10 are plotted here as a function of the temperature T, normalized in each case to the magnitude at 15ºC; Eqs. 7 and 8, when normalized both yielding the same curve, are shown by the light grey curve; Eq. 9, by the dark grey curve; and Eq. 10, by the black curve. The inset extends the temperature range of the main plot to 40ºC. B: intrinsic steady-state dose-response relation of the step Modulator concentration → Relaxation rate modulation, i.e., plot of R, as % of Rmax or the temperature-scaled Rmax (either Eq. 9 or 10), as a function of CSCP [or CMM: the intrinsic dose-response relations of the two modulators are identical (Brezina et al. 1996, 2003a)]. For further explanation see Second, structural mechanism of temperature compensation: saturating curvature of dose-response relations in Results.
Figure 12
Figure 12
Temperature compensation during realistic feeding behavior, simulated with the model. The model was run at 15ºC (A) or 25ºC (B). The two traces at the top of each of A and B, identical at the two temperatures, are the inputs to the model, the instantaneous firing frequencies of the motor neurons B15 and B16 extracted by Brezina et al. (2005) from the electrical activity recorded with an electrode chronically implanted in the ARC muscle by Horn et al. (2004) during a ~2½-h-long meal, comprising 749 cycles of the feeding behavior, in an intact, freely feeding animal. The traces below show the resulting trajectories of the most relevant downstream variables of the model (see Fig. 1): the SCP and MM concentrations CSCP and CMM, the modulation of the relaxation rate R, and the modulated contraction amplitude c. C: mean ± SD of the absolute relaxation rate measured from each of the 749 cycles of the meal, at 15ºC (blue) and 25ºC (red), with the full modulation (filled circles) or with the modulation of the relaxation rate disabled (e.g., with R(t) = 0; empty circles). The intrinsic temperature-dependencies of MM release and of the modulation of the relaxation rate by MM were modeled to be the same as for SCP; all other aspects of the model not already given in Fig. 2, 10, and 11 legends were as described by Brezina et al. (2003a,b).

Comment in

Similar articles

Cited by

References

    1. Bardales JR, Díaz-Enrich MJ, Ibarguren I, Villamarín JA. Isoforms of cAMP-dependent protein kinase in the bivalve mollusk Mytilus galloprovincialis: activation by cyclic nucleotides and effect of temperature. Arch Biochem Biophys. 2004;432:71–78. - PubMed
    1. Brezina V, Bank B, Cropper EC, Rosen S, Vilim FS, Kupfermann I, Weiss KR. Nine members of the myomodulin family of peptide cotransmitters at the B16-ARC neuromuscular junction of Aplysia. J Neurophysiol. 1995;74:54–72. - PubMed
    1. Brezina V, Church PJ, Weiss KR. Temporal pattern dependence of neuronal peptide transmitter release: models and experiments. J Neurosci. 2000a;20:6760–6772. - PMC - PubMed
    1. Brezina V, Evans CG, Weiss KR. Enhancement of Ca current in the accessory radula closer muscle of Aplysia californica by neuromodulators that potentiate its contractions. J Neurosci. 1994a;14:4393–4411. - PMC - PubMed
    1. Brezina V, Evans CG, Weiss KR. Activation of K current in the accessory radula closer muscle of Aplysia californica by neuromodulators that depress its contractions. J Neurosci. 1994b;14:4412–4432. - PMC - PubMed

Publication types