Mouse chromaffin cells have two populations of dense core vesicles
- PMID: 15944233
- PMCID: PMC12058276
- DOI: 10.1152/jn.00316.2005
Mouse chromaffin cells have two populations of dense core vesicles
Abstract
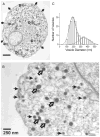
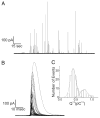
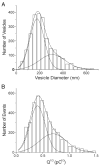
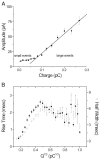
The quantal hypothesis states that neurotransmitter is released in discrete packages, quanta, thought to represent the neurotransmitter content of individual vesicles. If true, then vesicle size should influence quantal size. Although chromaffin cells are generally thought to have a single population of secretory vesicles, our electron microscopy analysis suggested two populations as the size distribution was best described as the sum of two Gaussians. The average volume difference was fivefold. To test whether this difference in volume affected quantal size, neurotransmitter release from permeabilized cells exposed to 100 microM Ca2+ was measured with amperometry. Quantal content was bimodally distributed with both large and small events; the distribution of vesicle sizes predicted by amperometry was extremely similar to those measured with electron microscopy. In addition, each population of events exhibited distinct release kinetics. These results suggest that chromaffin cells have two populations of dense core vesicles (DCV) with unique secretory properties and which may represent two distinct synthetic pathways for DCV biogenesis or alternatively they may represent different stages of biosynthesis.
Figures


Similar articles
-
Secretory vesicles membrane area is regulated in tandem with quantal size in chromaffin cells.J Neurosci. 2003 Aug 27;23(21):7917-21. doi: 10.1523/JNEUROSCI.23-21-07917.2003. J Neurosci. 2003. PMID: 12944522 Free PMC article.
-
Stimulation-dependent regulation of the pH, volume and quantal size of bovine and rodent secretory vesicles.J Physiol. 2002 Jul 15;542(Pt 2):453-76. doi: 10.1113/jphysiol.2002.018630. J Physiol. 2002. PMID: 12122145 Free PMC article.
-
Extracellular Osmotic Stress Reduces the Vesicle Size while Keeping a Constant Neurotransmitter Concentration.ACS Chem Neurosci. 2017 Feb 15;8(2):368-375. doi: 10.1021/acschemneuro.6b00350. Epub 2017 Jan 4. ACS Chem Neurosci. 2017. PMID: 27966899
-
The chromaffin vesicle: advances in understanding the composition of a versatile, multifunctional secretory organelle.Anat Rec (Hoboken). 2008 Dec;291(12):1587-602. doi: 10.1002/ar.20763. Anat Rec (Hoboken). 2008. PMID: 19037853 Review.
-
Relationship between amperometric pre-spike feet and secretion granule composition in chromaffin cells: an overview.Biophys Chem. 2007 Sep;129(2-3):181-9. doi: 10.1016/j.bpc.2007.05.018. Epub 2007 Jun 6. Biophys Chem. 2007. PMID: 17587484 Review.
Cited by
-
Omega-3 and -6 Fatty Acids Alter the Membrane Lipid Composition and Vesicle Size to Regulate Exocytosis and Storage of Catecholamines.ACS Chem Neurosci. 2024 Feb 21;15(4):816-826. doi: 10.1021/acschemneuro.3c00741. Epub 2024 Feb 12. ACS Chem Neurosci. 2024. PMID: 38344810 Free PMC article.
-
Fasting induces a form of autonomic synaptic plasticity that prevents hypoglycemia.Proc Natl Acad Sci U S A. 2016 May 24;113(21):E3029-38. doi: 10.1073/pnas.1517275113. Epub 2016 Apr 18. Proc Natl Acad Sci U S A. 2016. PMID: 27092009 Free PMC article.
-
RIM1/2-Mediated Facilitation of Cav1.4 Channel Opening Is Required for Ca2+-Stimulated Release in Mouse Rod Photoreceptors.J Neurosci. 2015 Sep 23;35(38):13133-47. doi: 10.1523/JNEUROSCI.0658-15.2015. J Neurosci. 2015. PMID: 26400943 Free PMC article.
-
PC12 cells that lack synaptotagmin I exhibit loss of a subpool of small dense core vesicles.Biophys J. 2014 Dec 16;107(12):2838-2849. doi: 10.1016/j.bpj.2014.10.060. Biophys J. 2014. PMID: 25517150 Free PMC article.
-
Inhibition of Ca2+ channels and adrenal catecholamine release by G protein coupled receptors.Cell Mol Neurobiol. 2010 Nov;30(8):1201-8. doi: 10.1007/s10571-010-9596-7. Cell Mol Neurobiol. 2010. PMID: 21061161 Free PMC article. Review.
References
-
- Albillos A, Dernick G, Horstmann H, Almers W, Alvarez de Toledo G, Lindau M. The exocytotic event in chromaffin cells revealed by patch amperometry. Nature. 1997;389:509–512. - PubMed
-
- Ales E, Tabares L, Poyato JM, Valero V, Lindau M, Alvarez de Toledo G. High calcium concentrations shift the mode of exocytosis to the kiss-and-run mechanism. Nat Cell Biol. 1999;1:40–44. - PubMed
-
- Anderson Ba. A Practical Information-Theoretic Approach. New York: Springer-Verlag; 2002. Model Selection and Multimodel Inference.
-
- Arancio O, Kiebler M, Lee CJ, Lev-Ram V, Tsien RY, Kandel ER, Hawkins RD. Nitric oxide acts directly in the presynaptic neuron to produce long- term potentiation in cultured hippocampal neurons. Cell. 1996;87:1025–1035. - PubMed
-
- Bauer RA, Khera RS, Lieber JL, Angleson JK. Recycling of intact dense core vesicles in neurites of NGF-treated PC12 cells. FEBS Lett. 2004a;571:107–111. - PubMed
Publication types
MeSH terms
Substances
Grants and funding
LinkOut - more resources
Full Text Sources
Other Literature Sources
Miscellaneous

