Comparative Study
. 2005 Oct;94(4):2427-46.
doi: 10.1152/jn.00280.2005. Epub 2005 Jun 8.

Variability of swallowing performance in intact, freely feeding aplysia

Affiliations
Comparative Study

Variability of swallowing performance in intact, freely feeding aplysia

Cecilia S Lum et al. J Neurophysiol. 2005 Oct.

Erratum in

  • J Neurophysiol. 2008 Oct;100(4):2453

Abstract

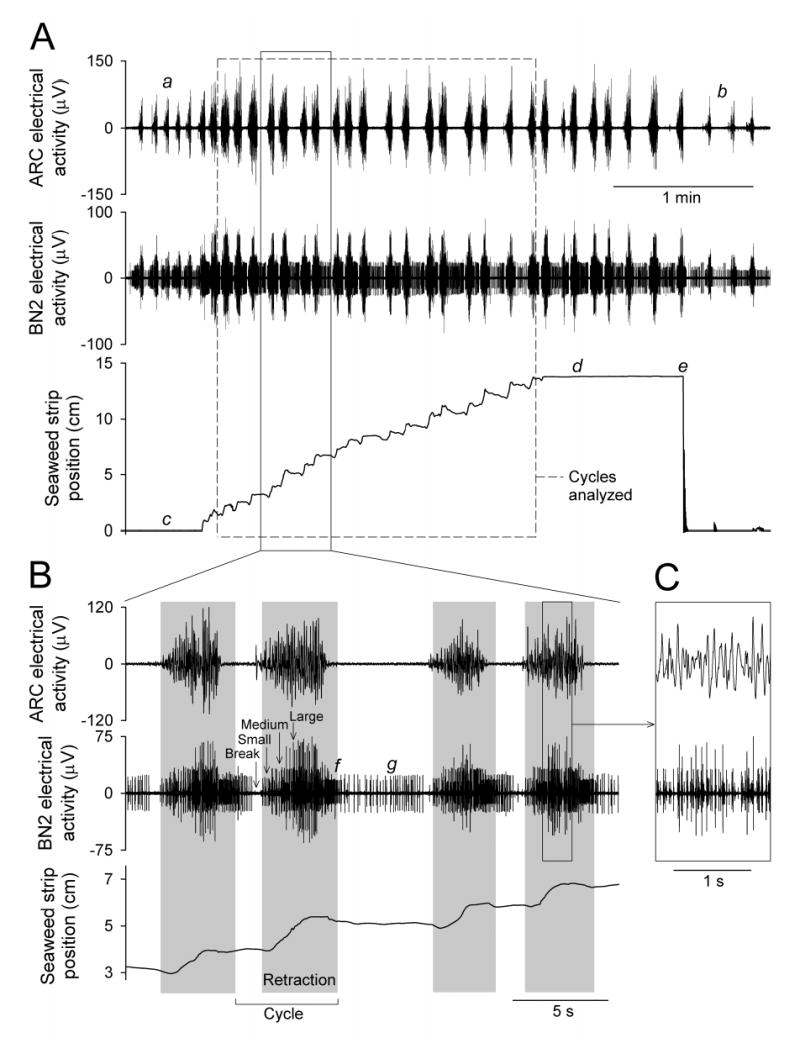
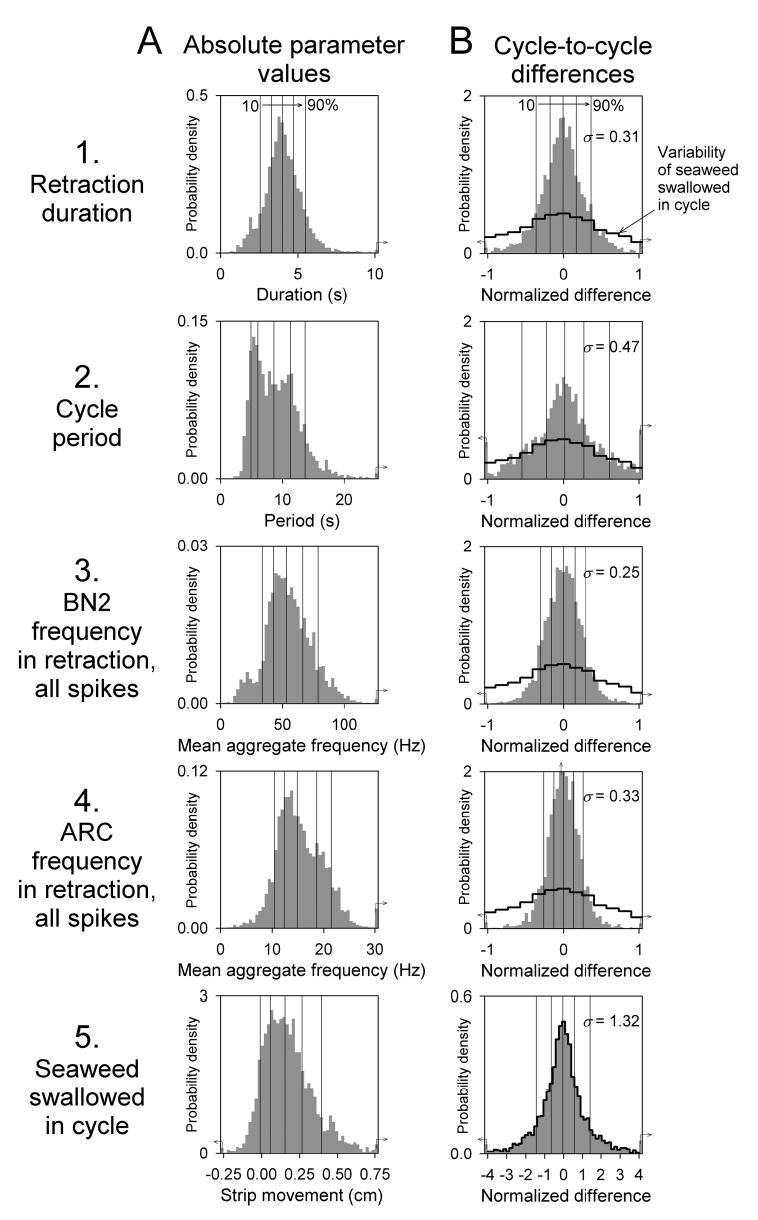
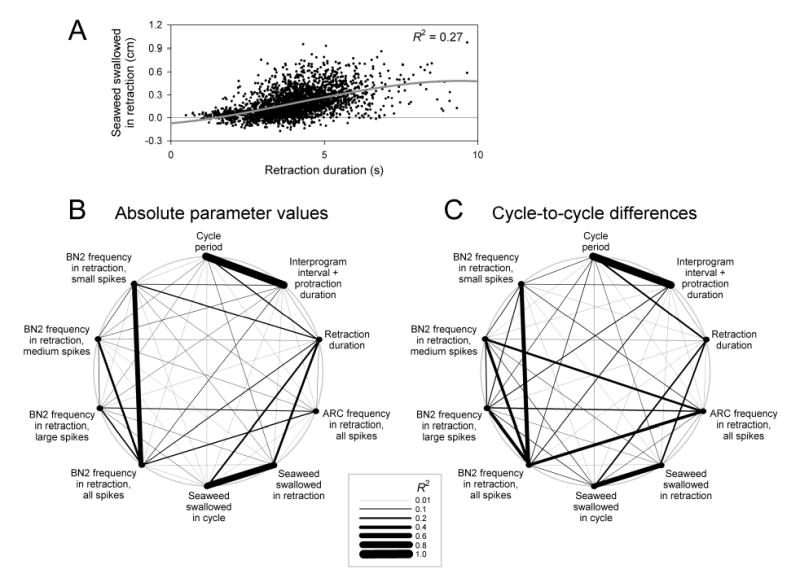
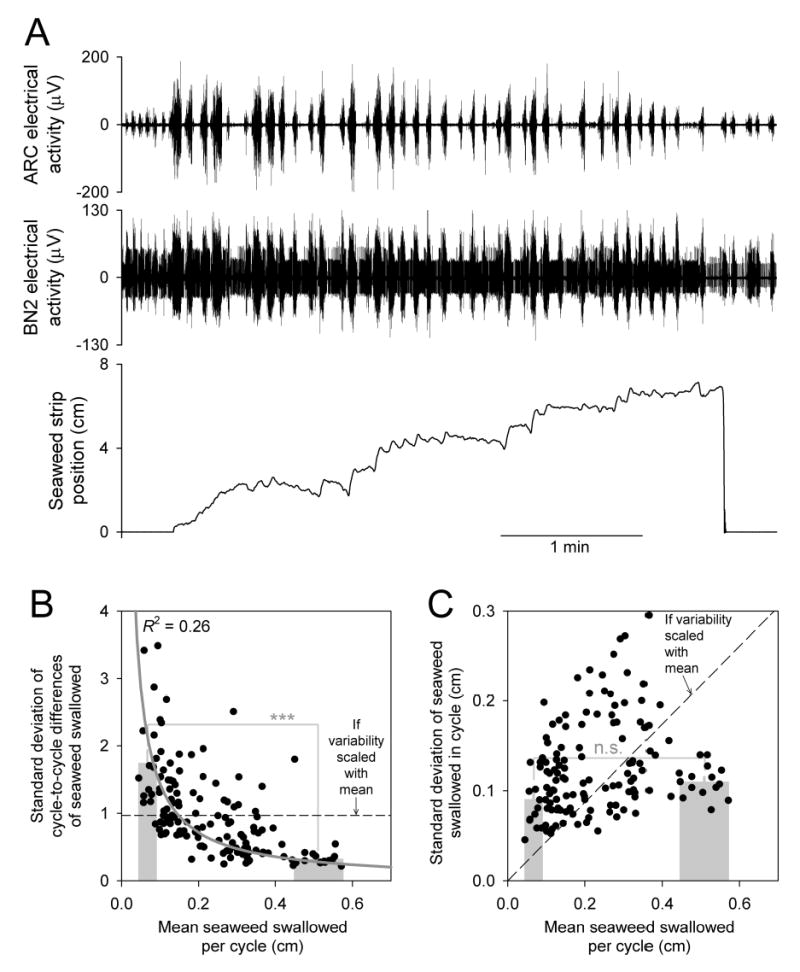
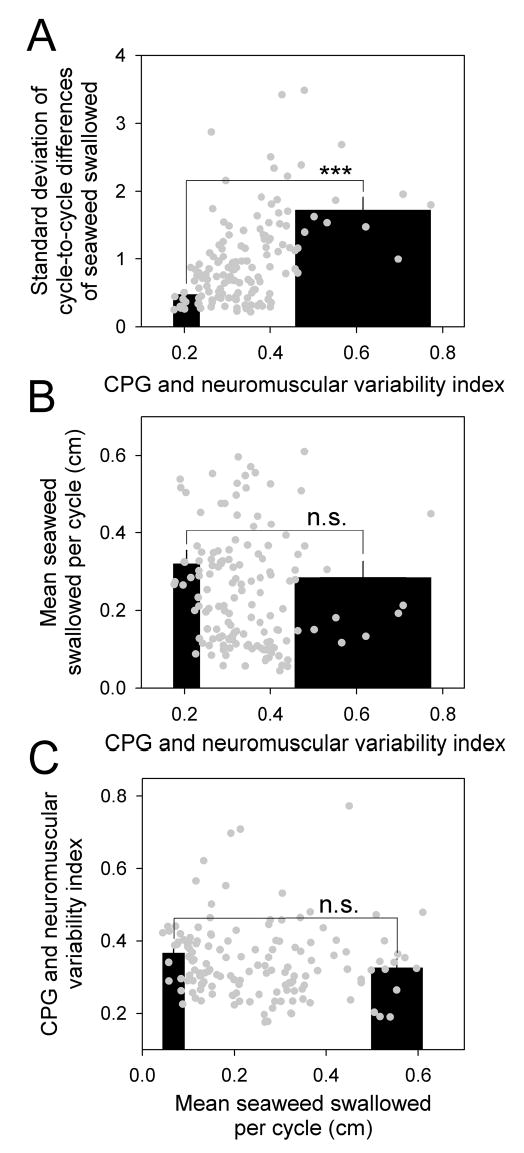
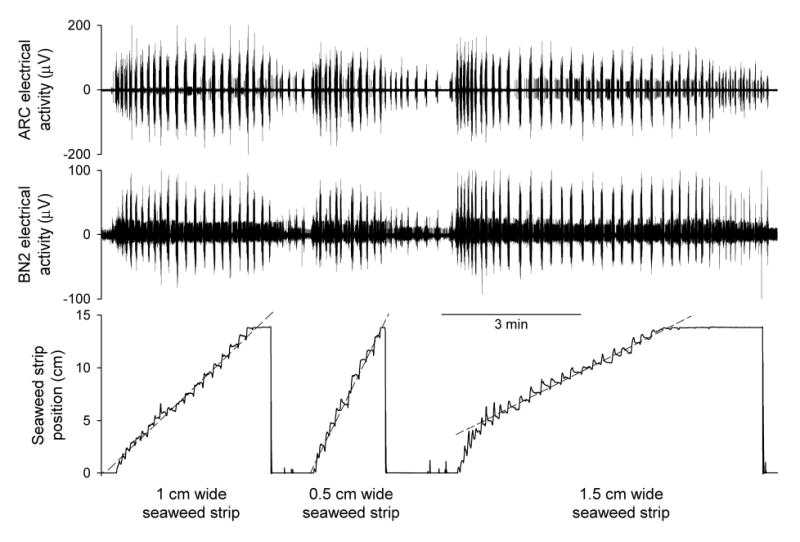
Variability in nervous systems is often taken to be merely "noise." Yet in some cases it may play a positive, active role in the production of behavior. The central pattern generator (CPG) that drives the consummatory feeding behaviors of Aplysia generates large, quasi-random variability in the parameters of the feeding motor programs from one cycle to the next; the variability then propagates through the firing patterns of the motor neurons to the contractions of the feeding muscles. We have proposed that, when the animal is faced with a new, imperfectly known feeding task in each cycle, the variability implements a trial-and-error search through the space of possible feeding movements. Although this strategy will not be successful in every cycle, over many cycles it may be the optimal strategy for feeding in an uncertain and changing environment. To play this role, however, the variability must actually appear in the feeding movements and, presumably, in the functional performance of the feeding behavior. Here we have tested this critical prediction. We have developed a technique to measure, in intact, freely feeding animals, the performance of Aplysia swallowing behavior, by continuously recording with a length transducer the movement of the seaweed strip being swallowed. Simultaneously, we have recorded with implanted electrodes activity at each of the internal levels, the CPG, motor neurons, and muscles, of the feeding neuromusculature. Statistical analysis of a large data set of these recordings suggests that functional performance is not determined strongly by one or a few parameters of the internal activity, but weakly by many. Most important, the internal variability does emerge in the behavior and its functional performance. Even when the animal is swallowing a long, perfectly regular seaweed strip, remarkably, the length swallowed from cycle to cycle is extremely variable, as variable as the parameters of the activity of the CPG, motor neurons, and muscles.


Figures

Figure 1
Figure 1
Typical records obtained during the swallowing of a standard 1 × 15 cm seaweed strip. A shows (top to bottom) the electrical activity in the ARC muscle, the electrical activity in buccal nerve 2 (BN2), and the position of the strip measured with the length transducer, for the entire strip; B and C show successive expansions of the indicated portions of the records. The dashed box in A encloses the sequence of cycles selected for analysis from this strip by the criteria described in Methods. The grey rectangles in B mark the durations of the retraction phases determined from the bursts of electrical activity in buccal nerve 2 as described in Methods. The labels “Small”, “Medium”, and “Large” indicate the three classes of spikes, with small, medium, and large amplitudes, used in this determination (see Methods). The other labels in the figure indicate other features referred to in the Methods and Results. The buccal nerve 2 record in B and C has been additionally filtered in software with an 8-pole Bessel high-pass filter with a −3 dB cutoff frequency of 100 Hz.
Figure 2
Figure 2
Strip movements are movements of the buccal mass, not of the whole body. A and B: two video frames (from two different experiments) taken from the video segments at http://fulcrum.physbio.mssm.edu/~seaslug/Seaweed.html. C: position of the seaweed strip recorded with the length transducer, over the middle sequence of analyzed cycles, as in the dashed box in Fig. 1A, of a typical strip, and a simultaneous record of the vertical position of a skin feature on the animal’s head analyzed from the frames of a side-view video recording such as that in B (see Methods). The vertical offset of the head-position record is arbitrary. D: group data comparing strip and head movement. Video frames were analyzed every 533 ms, and the vertical movement of the head was computed from the difference in vertical position of the tracked feature between successive frames (the results were essentially identical if the difference was computed over longer intervals, i.e., multiple frame increments). The strip movement was then computed from the transducer record over the same times in exactly the same way. Plotted are 2,984 such (strip movement, head movement) pairs (i.e., spanning ~26 min) computed from 241 swallowing cycles in 5 strips. Multiple linear regression (see Methods) found no correlation between the strip and head movement (R2 < 0.01).
Figure 3
Figure 3
Variability of the temporal profiles of buccal nerve 2 and ARC muscle electrical activity and movement of the seaweed strip in each cycle. Segments of the instantaneous firing frequency functions of the small, medium, and large classes of spikes in buccal nerve 2 (BN2), constructed as described in Methods (plots 1-3), the similarly constructed function of all of the buccal nerve 2 spikes combined (plot 4), the similarly constructed function of all of the peaks or spikes in the ARC muscle record (plot 5), and the instantaneous position of the seaweed strip (plot 6) were cut from each of the cycles in the dataset (n = 2,755) and aligned at the beginning of the retraction phase of the cycle (vertical line at time = 0). For each of the resulting ensemble distributions, the 10th, 25th, 50th (median), 75th, and 90th percentiles were determined at each timepoint, then plotted over all of the timepoints to form the profiles shown here. In plots 1-5, before the beginning and after the end of each individual cycle, its firing frequency functions were set to a nominal negative value. As a result, each ensemble percentile profile becomes negative, and so appears to end in these plots, at the corresponding percentile of the distribution of the durations of the preceding interprogram interval plus protraction phase, before time = 0, or the durations of the retraction phase, after time = 0, explicitly shown by the grey bars at the bottom. (The latter distribution is the same as that shown in Fig. 4A1.) In plot 6, the instantaneous position of the strip in each cycle was offset, by subtracting the position at the beginning of the cycle, so as to be zero at the beginning of the cycle and, nominally, at all previous timepoints. After the end of each cycle, the position was set to that attained at the end of the cycle, so that each ensemble percentile profile attains a final plateau at the corresponding percentile of the distribution of all lengths of seaweed swallowed, explicitly shown by the grey bar at right. (This distribution is the same as that shown in Fig. 4A5.)
Figure 4
Figure 4
Variability of the absolute values and cycle-to-cycle differences of five representative parameters of the buccal nerve 2 and ARC electrical activity and movement of the seaweed strip. All cycles in the dataset (n = 2,755) were measured for their retraction duration, as defined by the duration of the buccal nerve 2 spike burst (row 1), cycle period (= retraction duration + duration of preceding protraction and interprogram interval; row 2), the mean frequency of all buccal nerve 2 (BN2) spikes in retraction, that is, in the retraction-defining burst (row 3), the mean frequency of all peaks or spikes in the ARC muscle record in retraction (row 4), and the length of seaweed swallowed in the cycle (row 5). A (left column): distributions of the absolute values of these five parameters, scaled so as to approximate probability density functions. The thin vertical lines indicate the 10th, 25th, 50th (median), 75th, and 90th percentiles of each distribution. B (right column): distributions of the cycle-to-cycle differences of the five parameters. As in A, except that the absolute parameter values were further processed by pairwise subtraction to yield the differences between each cycle and the immediately preceding cycle in the same strip. The differences in each strip were normalized by the mean of the absolute values of the parameter in that strip, so that −1 and +1 on the horizontal axis of the plots in B indicate decreases and increases, respectively, equal in magnitude to the mean of the parameter. In addition to the percentile lines, the standard deviation of each distribution, σ, is given. Note that the cycle-to-cycle distribution of the lengths of seaweed swallowed, in B5, is much broader, and is plotted over a more extended range, than the other cycle-to-cycle distributions. To emphasize this, the outline of the former is superimposed over each of the latter in B1-B4 (black outline labeled “Variability of seaweed swallowed in cycle”). In many of the plots, the first bar of the distribution contains pooled smaller values (small left-pointing arrow) and the last bar contains pooled larger values (small right-pointing arrow).
Figure 5
Figure 5
Correlations between parameters of the buccal nerve 2 and ARC electrical activity and movement of the seaweed strip. The five parameters in Fig. 4 were used and in addition the following five parameters: the duration of the protraction and interprogram interval preceding the retraction in each cycle, the mean frequencies of the three separate classes of spikes, with small, medium, and large amplitudes, in buccal nerve 2 (BN2), and the length of seaweed swallowed in retraction. The values of these ten parameters, drawn from all cycles in the dataset (n = 2,755), were correlated pairwise, using multiple linear regression to fit the values of the dependent parameter with a cubic polynomial model of the independent parameter (see Methods). A shows one such correlation plot; the best cubic polynomial fit is shown (grey curve) and the value of the coefficient of determination, R2, is given. B then shows the strengths of the correlations—the values of R2, represented by the thickness of each line—between the absolute values of all ten parameters, and C between the corresponding cycle-to-cycle differences. Of the two reciprocal correlations between each pair of parameters, the stronger correlation is represented; however, the two were generally not very different (see Fig. 6).
Figure 6
Figure 6
Correlations between parameters of the buccal nerve 2 and ARC electrical activity and movement of the seaweed strip: numerical results for the correlations between the cycle-to-cycle differences of the ten parameters plotted in Fig. 5C. Each cell gives R2 (top number), the p value (middle number), and Cohen’s d (bottom number) for the correlation between the independent (row) and dependent (column) parameter, computed as described in Methods. The p values were in each case drawn from the F3,2608 distribution. For further explanation see Functional performance is not explained by any single parameter of CPG or neuromuscular activity in Results.
Figure 7
Figure 7
Relationship of variability to overall functional success: variability of the movement of the seaweed strip related to the mean movement. A: example of a seaweed strip swallowed with particularly large variability in the records of buccal nerve 2 and ARC electrical activity as well as in the movement of the strip. The mean movement per cycle was also small; the animal may have had difficulty swallowing the strip (note that the strip broke or was cut when only partly ingested), possibly exacerbated by the fact that this strip was 1.5 cm, rather than the standard 1 cm, wide. However, similarly large variability was seen with some 1-cm strips (see, e.g., B and C), and, conversely, smaller variability with other 1.5-cm strips. Otherwise as in Fig. 1. B: plot of the standard deviation of the cycle-to-cycle differences of the seaweed swallowed, σ (as in Fig. 4B5 but computed separately for each strip), as a function of the mean seaweed swallowed per cycle, μ, for each of the 143 strips (black points) in the dataset. (The dataset included only 1-cm strips; thus the strip in A was not included.) The grey curve is the best fit, with R2 = 0.26, of the equation σ = k/μ, where k is a parameter of the fit. The superimposed bar graph plots the mean ± SE of σ of the 14 strips (~10% of the dataset) with the smallest μ and of the 14 strips with the largest μ. The width of each bar spans the range of μ of the strips included in it. For statistical analysis see Methods and How does the variability relate to overall functional success? in Results. C: as in B, but plotting the standard deviation of the absolute lengths of the seaweed swallowed (i.e., of the distribution in Fig. 4A5 but computed separately for each strip) as a function of μ.
Figure 8
Figure 8
Relationship of variability to overall functional success: variability of CPG and neuromuscular activity related to the variability and mean movement of the seaweed strip. The “CPG and neuromuscular variability index” was computed, for each strip, as the sixth root of the product of the standard deviations of the cycle-to-cycle differences of the six independent parameters of CPG and neuromuscular activity that were measured in Figs. 4 and 5: the retraction duration, the interprogram interval and protraction duration, the frequencies of the three separate classes of spikes in buccal nerve 2, and the ARC spike frequency. A: standard deviation of the cycle-to-cycle differences of the seaweed swallowed as a function of the variability index, for each of the 143 strips in the dataset (grey points), and statistical analysis as in Fig. 7, B and C. The best-fit cubic curve (not shown) through the points had R2 = 0.29. B: mean seaweed swallowed per cycle as a function of the variability index. C: variability index as a function of the mean seaweed swallowed per cycle.
Figure 9
Figure 9
Seaweed strips of different widths are ingested at different average rates, but in all cases with large variability. The dashed lines indicating the average rates of movement of the seaweed strip were drawn by eye. Otherwise as in Fig. 1.

Similar articles

Cited by

References

    1. Beer RD, Chiel HJ, Gallagher JC. Evolution and analysis of model CPGs for walking: II. General principles and individual variability. J Comput Neurosci. 1999;7:119–147. - PubMed
    1. Bernstein N.The Co-ordination and Regulation of Movement. Oxford: Pergamon Press, 1967.
    1. Brezina V, Horn CC, Weiss KR. Modeling neuromuscular modulation in Aplysia. III. Interaction of central motor commands and peripheral modulatory state for optimal behavior. J Neurophysiol. 2005a;93:1523–1556. - PubMed
    1. Brezina V, Orekhova IV, Weiss KR. The neuromuscular transform: the dynamic, nonlinear link between motor neuron firing patterns and muscle contraction in rhythmic behaviors. J Neurophysiol. 2000a;83:207–231. - PubMed
    1. Brezina V, Orekhova IV, Weiss KR. Optimization of rhythmic behaviors by modulation of the neuromuscular transform. J Neurophysiol. 2000b;83:260–279. - PubMed

Publication types

LinkOut - more resources