

Genomic mapping of direct and correlated responses to long-term selection for rapid growth rate in mice
- PMID: 15944354
- PMCID: PMC1449794
- DOI: 10.1534/genetics.105.041319
Genomic mapping of direct and correlated responses to long-term selection for rapid growth rate in mice
Abstract
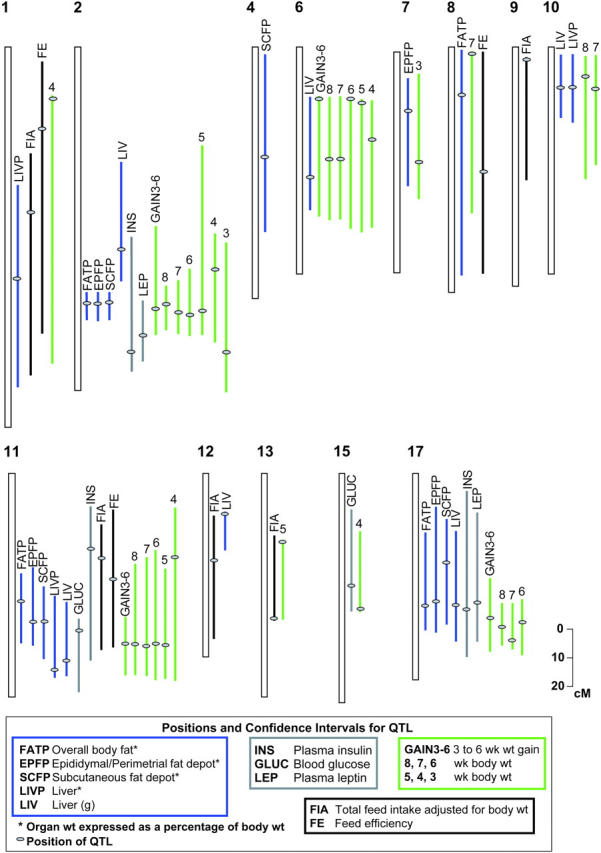
Understanding the genetic architecture of traits such as growth, body composition, and energy balance has become a primary focus for biomedical and agricultural research. The objective of this study was to map QTL in a large F(2) (n = 1181) population resulting from an intercross between the M16 and ICR lines of mice. The M16 line, developed by long-term selection for 3- to 6-week weight gain, is larger, heavier, fatter, hyperphagic, and diabetic relative to its randomly selected control line of ICR origin. The F(2) population was phenotyped for growth and energy intake at weekly intervals from 4 to 8 weeks of age and for body composition and plasma levels of insulin, leptin, TNFalpha, IL6, and glucose at 8 weeks and was genotyped for 80 microsatellite markers. Since the F(2) was a cross between a selection line and its unselected control, the QTL identified likely represent genes that contributed to direct and correlated responses to long-term selection for rapid growth rate. Across all traits measured, 95 QTL were identified, likely representing 19 unique regions on 13 chromosomes. Four chromosomes (2, 6, 11, and 17) harbored loci contributing disproportionately to selection response. Several QTL demonstrating differential regulation of regional adipose deposition and age-dependent regulation of growth and energy consumption were identified.
Figures
Similar articles
-
Identification of quantitative trait loci influencing traits related to energy balance in selection and inbred lines of mice.Genetics. 1999 Jun;152(2):699-711. doi: 10.1093/genetics/152.2.699. Genetics. 1999. PMID: 10353911 Free PMC article.
-
Genetic analysis of an F(2) intercross between two chicken lines divergently selected for body-weight.BMC Genomics. 2009 May 27;10:248. doi: 10.1186/1471-2164-10-248. BMC Genomics. 2009. PMID: 19473501 Free PMC article.
-
Primary genome scan to identify putative quantitative trait loci for feedlot growth rate, feed intake, and feed efficiency of beef cattle.J Anim Sci. 2007 Dec;85(12):3170-81. doi: 10.2527/jas.2007-0234. Epub 2007 Aug 20. J Anim Sci. 2007. PMID: 17709790
-
Low-coverage sequencing in a deep intercross of the Virginia body weight lines provides insight to the polygenic genetic architecture of growth: novel loci revealed by increased power and improved genome-coverage.Poult Sci. 2023 May;102(5):102203. doi: 10.1016/j.psj.2022.102203. Epub 2022 Oct 1. Poult Sci. 2023. PMID: 36907123 Free PMC article.
-
Quantitative trait loci (QTLs) mapping for growth traits in the mouse: a review.Genet Sel Evol. 2001 Mar-Apr;33(2):105-32. doi: 10.1186/1297-9686-33-2-105. Genet Sel Evol. 2001. PMID: 11333830 Free PMC article. Review.
Cited by
-
Mapping novel QTL and fine mapping of previously identified QTL associated with glucose tolerance using the collaborative cross mice.Mamm Genome. 2024 Mar;35(1):31-55. doi: 10.1007/s00335-023-10025-0. Epub 2023 Nov 17. Mamm Genome. 2024. PMID: 37978084
-
High-resolution mapping of a genetic locus regulating preferential carbohydrate intake, total kilocalories, and food volume on mouse chromosome 17.PLoS One. 2014 Oct 20;9(10):e110424. doi: 10.1371/journal.pone.0110424. eCollection 2014. PLoS One. 2014. PMID: 25330228 Free PMC article.
-
Sex-, diet-, and cancer-dependent epistatic effects on complex traits in mice.Front Genet. 2011 Oct 28;2:71. doi: 10.3389/fgene.2011.00071. eCollection 2011. Front Genet. 2011. PMID: 22303366 Free PMC article.
-
Exercise, weight loss, and changes in body composition in mice: phenotypic relationships and genetic architecture.Physiol Genomics. 2011 Feb 24;43(4):199-212. doi: 10.1152/physiolgenomics.00217.2010. Epub 2010 Dec 14. Physiol Genomics. 2011. PMID: 21156834 Free PMC article.
-
Genetic regulation of hypothalamic cocaine and amphetamine-regulated transcript (CART) in BxD inbred mice.Brain Res. 2008 Feb 15;1194:1-7. doi: 10.1016/j.brainres.2007.11.074. Epub 2007 Dec 14. Brain Res. 2008. PMID: 18199428 Free PMC article.
References
-
- Allan, M. F., E. J. Eisen and D. Pomp, 2004. The M16 mouse: an outbred animal model of early onset polygenic obesity-induced diabetes (diabesity). Obes. Res. 12: 1397–1407. - PubMed
-
- Anunciado, R. V., M. Nishimura, M. Mori, A. Ishikawa, S. Tanaka et al., 2003. Quantitative trait locus analysis of serum insulin, triglyceride, total cholesterol and phospholipid levels in the (SM/J × A/J) mice. Exp. Anim. 52: 37–42. - PubMed
-
- Atzmon, G., X. M. Yang, R. Muzumdar, X. H. Ma, I. Gabriely et al., 2002. Differential gene expression between visceral and subcutaneous fat depots. Horm. Metab. Res. 34: 622–628. - PubMed
-
- Brockmann, G. A., and M. R. Bevova, 2002. Using mouse models to dissect the genetics of obesity. Trends Genet. 18: 367–376. - PubMed
MeSH terms
Substances
LinkOut - more resources
Full Text Sources
Medical
Molecular Biology Databases
Miscellaneous
