. 2006 Jan;172(1):593-609.
doi: 10.1534/genetics.104.039982. Epub 2005 Jun 8.

Selection for recombination in structured populations

Affiliations

Selection for recombination in structured populations

Guillaume Martin et al. Genetics. 2006 Jan.

Abstract

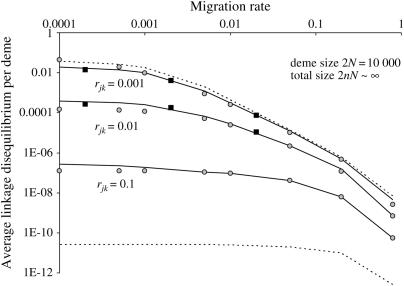
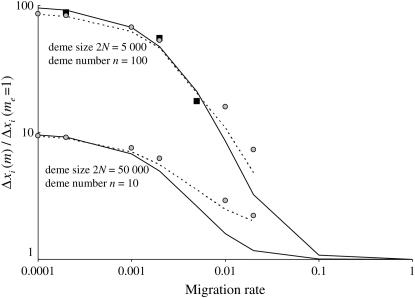
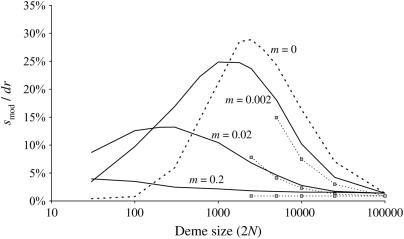
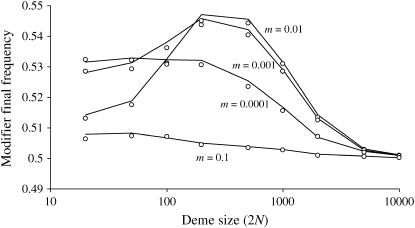
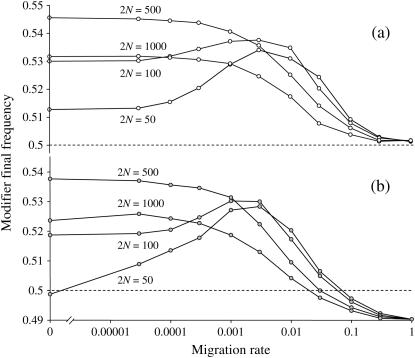
In finite populations, linkage disequilibria generated by the interaction of drift and directional selection (Hill-Robertson effect) can select for sex and recombination, even in the absence of epistasis. Previous models of this process predict very little advantage to recombination in large panmictic populations. In this article we demonstrate that substantial levels of linkage disequilibria can accumulate by drift in the presence of selection in populations of any size, provided that the population is subdivided. We quantify (i) the linkage disequilibrium produced by the interaction of drift and selection during the selective sweep of beneficial alleles at two loci in a subdivided population and (ii) the selection for recombination generated by these disequilibria. We show that, in a population subdivided into n demes of large size N, both the disequilibrium and the selection for recombination are equivalent to that expected in a single population of a size intermediate between the size of each deme (N) and the total size (nN), depending on the rate of migration among demes, m. We also show by simulations that, with small demes, the selection for recombination is stronger than both that expected in an unstructured population (m = 1 - 1/n) and that expected in a set of isolated demes (m = 0). Indeed, migration maintains polymorphisms that would otherwise be lost rapidly from small demes, while population structure maintains enough local stochasticity to generate linkage disequilibria. These effects are also strong enough to overcome the twofold cost of sex under strong selection when sex is initially rare. Overall, our results show that the stochastic theories of the evolution of sex apply to a much broader range of conditions than previously expected.


Figures

Figure 1.
Figure 1.
Log-log plot of the maximum absolute value of the average LD between the selected loci, that is reached during the sweeps, for varying migration rate (x-axis) and for three recombination rates (indicated on the graph). The values were obtained from iteration of recursion (21) (lines), from simulations (squares), or from the weak selection approximation (28) (shaded circles). Dashed curves indicate the two limits for the recombination rates r = 0 (top line) and r = formula image (bottom line). For each value of m and r, the number of demes n was chosen large enough (always >500) that further increasing n had very little effect on the result (infinite population limit). Simulation results were averaged over 1800 (m = 0.0002 and 0.002) and 10,000 (m = 0.02) sweeps. Other parameters are sj = sk = 0.005, with an initial beneficial allele frequency of 0.1 at both loci and deme size 2N = 10,000.
Figure 2.
Figure 2.
Value of the average modifier frequency change over time Δxi, scaled to the modifier effect (dr = 0.03) for three values of the migration rate m indicated on the graph. Lines indicate the values obtained from recursion (21) for three loci and dots indicate the results of simulations with 95% confidence intervals averaged over 107 sweeps. Other parameters are n = 5, 2N = 10,000, rjk = rij = sj = sk = 0.1, an initial beneficial allele frequency of 0.01, and an initial modifier frequency xi = 0.5.
Figure 3.
Figure 3.
Ratio between the cumulative modifier frequency change, over the selective sweeps, in a structured population, Δxi(m), and the same frequency change in the absence of structure, Δxi(me = 1), for different values of the migration rate m (x-axis, on log scale). The total population size is kept constant 2nN = 500,000 with either 100 demes of size 2N = 5000 (top curve) or 10 demes of size 2N = 50,000 (bottom curve). The values are obtained with iteration of recursion (21) (solid lines), with the QLE approximation (29) (dashed lines), or with the single-population QLE approximation (29) with a population size 2NQLE given in (27) (shaded circles). Simulation results averaged over 10,000 sweeps are indicated for the case 2N = 5000 (solid squares). Other parameters are sj = sk = rij = rjk = 0.01, with an initial beneficial allele frequency of 0.1, and a modifier effect dr = 0.005 with initial frequency xi = 0.5.
Figure 4.
Figure 4.
Effect of population structure on the per generation selection coefficient on the recombination modifier, smod, averaged over the t generations of the selective sweep and scaled by the modifier effect dr. smod = Δxi(t)/(txi(1 − xi)), where Δxi(t) is the average cumulative modifier frequency change over the selective sweep. The value is given for different deme sizes 2N (x-axis) and migration rates (indicated). Lines show simulation results and dots indicate the prediction from recursion (21) iterated over t = 100 generations (the expected time taken by the selective sweep along the deterministic trajectory). Other parameters are sj = sk = 0.1, rij = rjk = 0.01, with an initial beneficial allele frequency of 0.02, and a modifier effect dr = 0.005 with initial frequency xi = 0.5.
Figure 5.
Figure 5.
Effect of population structure on modifier final frequency at the end of the sweeps (the initial frequency is 0.5) for different deme sizes 2N (x-axis) and migration rates (indicated) under strong selection (sj = sk = 1). The total population size is kept constant, 2nN = 10,000. Lines correspond to a sex modifier with the probability to reproduce sexually (with recombination rate set to formula image) σ1 = 0.02, σ2 = 0.03, and σ3 = 0.04 for individuals carrying zero, one, or two copies of the modifier, respectively. Dots correspond to a recombination modifier with dr = 0.005 and rij = rjk = 0.015. Initial frequency of selected alleles is 0.01.
Figure 6.
Figure 6.
Effect of population structure on a sex modifier final frequency at the end of the sweeps (the initial frequency is 0.5) for different deme sizes 2N (indicated) and migration rates (x-axis, note the log-scale and the value for m = 0) under strong selection (sj = sk = 1). The total population size is kept constant, 2nN = 10,000. As in Figure 5, the probability to reproduce sexually (with recombination rate set to formula image) is σ1 = 0.02, σ2 = 0.03, and σ3 = 0.04 for individuals carrying zero, one, or two copies of the modifier, respectively. In a, there is no cost of sex whereas in b individuals who reproduce sexually produce half as many daughters compared to individuals reproducing asexually (twofold cost). Initial frequency of selected alleles is 0.01.
Figure 7.
Figure 7.
Effect of population structure on a sex modifier final frequency at the end of the sweeps. The same as that in Figure 6b is shown (with a twofold cost of sex) but for asexuals vs. weakly sexual organisms (σ1 = 0, σ2 = 0.01, and σ3 = 0.02), weaker selection (sj = sk = 0.1), and larger total population size (2nN = 100,000).

Similar articles

Cited by

References

    1. Agrawal, A. F., and J. R. Chasnov, 2001. Recessive mutations and the maintenance of sex in structured populations. Genetics 158: 913–917. - PMC - PubMed
    1. Barton, N. H., 1995. a A general model for the evolution of recombination. Genet. Res. 65: 123–144. - PubMed
    1. Barton, N. H., 1995. b Linkage and the limits to natural selection. Genetics 140: 821–841. - PMC - PubMed
    1. Barton, N. H., and K. S. Gale, 1993. Genetic analysis of hybrid zones, pp. 13–45 in Hybrid Zones and the Evolutionary Process, edited by R. G. Harrison. Oxford University Press, Oxford.
    1. Barton, N., and S. P. Otto, 2005. Evolution of recombination due to random drift. Genetics 169: 2353–2370. - PMC - PubMed

Publication types