Comparative Study
. 2005 Aug;170(4):1459-72.
doi: 10.1534/genetics.104.039107. Epub 2005 Jun 8.

The exchangeability of amino acids in proteins

Affiliations
Comparative Study

The exchangeability of amino acids in proteins

Lev Y Yampolsky et al. Genetics. 2005 Aug.

Abstract

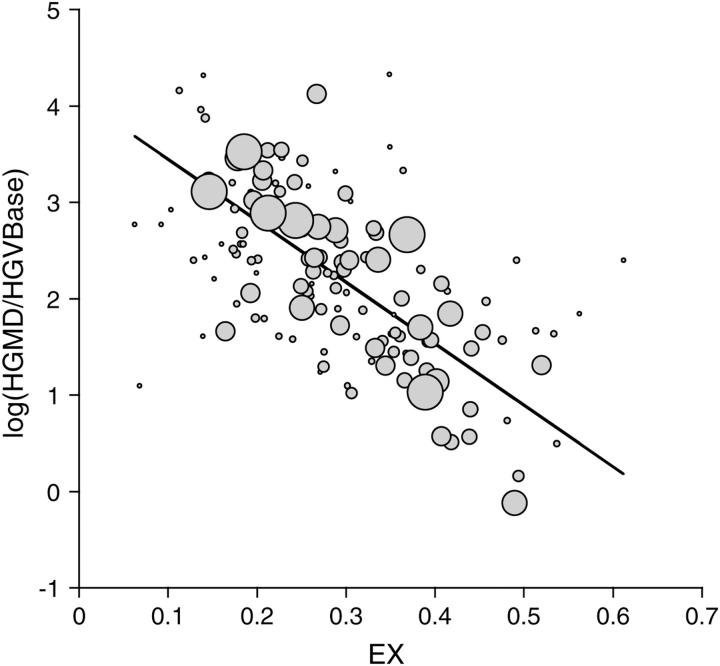
The comparative analysis of protein sequences depends crucially on measures of amino acid similarity or distance. Many such measures exist, yet it is not known how well these measures reflect the operational exchangeability of amino acids in proteins, since most are derived by methods that confound a variety of effects, including effects of mutation. In pursuit of a pure measure of exchangeability, we present (1) a compilation of data on the effects of 9671 amino acid exchanges engineered and assayed in a set of 12 proteins; (2) a statistical procedure to combine results from diverse assays of exchange effects; (3) a matrix of "experimental exchangeability" values EX(ij) derived from applying this procedure to the compiled data; and (4) a set of three tests designed to evaluate the power of an exchangeability measure to (i) predict the effects of amino acid exchanges in the laboratory, (ii) account for the disease-causing potential of missense mutations in the human population, and (iii) model the probability of fixation of missense mutations in evolution. EX not only captures useful information on exchangeability while remaining free of other effects, but also outperforms all measures tested except for the best-performing alignment scoring matrix, which is comparable in performance.


Figures

F<sc>igure</sc> 1.—
Figure 1.—
Assigning activity scores to categories based on a frequency distribution. (a) A hypothetical distribution of variants, with 47% in the “minus” class and the remainder in the “plus” class. (b) The fit of this classification to a known frequency distribution of effects on activity. For any given frequency distribution, there is a unique value T that divides the density into a minus class of 47% and a plus class with the remainder. Then, for this frequency distribution, variants in each class can be assigned a unique mean activity value (e.g., Aminus for variants in the minus category). This approach generalizes to any number of ranked categories.
F<sc>igure</sc> 2.—
Figure 2.—
Empirical severity-of-effect distribution. The observed frequency of amino acid exchange variants pT that fall below some threshold of activity T is shown as a function of the threshold, on a double-log scale. Data on this relationship are available from seven studies (for details, see supplementary materials at http://www.genetics.org/supplemental/): the lysozyme (pink dot), barnase (black dot), and β-lactamase (yellow dot) studies each contribute a single point; two points are available from the interleukin-3 study (brown dots); three points from the LacI study (gray dots); and the observed discretized frequency distribution is available for 37 insulin variants (blue dots) and 366 HIV-RT variants (orange dots). The sizes of dots represent weights assigned to each point for purposes of regression. The dashed line is the best fit (residual sum-of-squares, 0.13) to a cumulative frequency distribution based on the power law (Equation 1).
F<sc>igure</sc> 3.—
Figure 3.—
Relationship of disease-causing potential to EX. The vertical scale is the log of the disease-causing potential, defined as the ratio of the number of HGMD (Krawczak and Cooper 1997) entries for a given missense class, to the number of HGVBase (Fredman et al. 2002) entries for the same class. For reasons explained in the text, this ratio is expected to reflect disease-causing potential and to be free of confounding effects of mutation. The solid line shows the weighted least-squares regression, y = 4.08 − 6.38x, with weights based on Table 2 (weight of each point is reflected by its size). EX explains 49% of the variance in the log HGMD/HGVBase ratio, more than any other measure tested. Given the observed regression, one way to describe how HGMD is enriched (relative to HGVBase) in low-exchangeability variants is to note that the bottom one-third of the distribution of EX values is enriched 2.4-fold relative to the overall sample and ∼9-fold relative to the top one-third.

Similar articles

Cited by

References

    1. Alexandre, G., and I. B. Zhulin, 2003. Different evolutionary constraints on chemotaxis proteins CheW and CheY revealed by heterologous expression studies and protein sequence analysis. J. Bacteriol. 185: 544–552. - PMC - PubMed
    1. Altschul, S. F., 1991. Amino acid substitution matrices from an information theoretic perspective. J. Mol. Biol. 219: 555–565. - PMC - PubMed
    1. Atchley, W. R., T. Lokot, K. Wollenberg, A. Dress and H. Ragg, 2001. Phylogenetic analyses of amino acid variation in the serpin proteins. Mol. Biol. Evol. 18: 1502–1511. - PubMed
    1. Axe, D. D., N. W. Foster and A. R. Fersht, 1998. A search for single substitutions that eliminate enzymatic function in a bacterial ribonuclease. Biochemistry 37: 7157–7166. - PubMed
    1. Benner, S. A., M. A. Cohen and G. H. Gonnet, 1994. Amino acid substitution during functionally constrained divergent evolution of protein sequences. Protein Eng. 7: 1323–1332. - PubMed

Publication types