. 2005 Sep;171(1):279-89.
doi: 10.1534/genetics.104.035915. Epub 2005 Jun 8.

Balancing selection in the wild: testing population genetics theory of self-incompatibility in the rare species Brassica insularis

Affiliations

Balancing selection in the wild: testing population genetics theory of self-incompatibility in the rare species Brassica insularis

Sylvain Glémin et al. Genetics. 2005 Sep.

Abstract

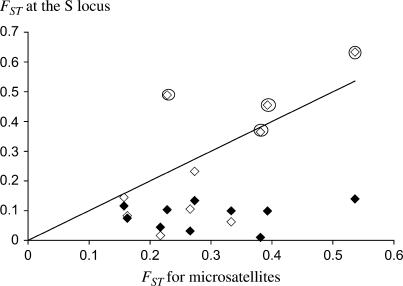
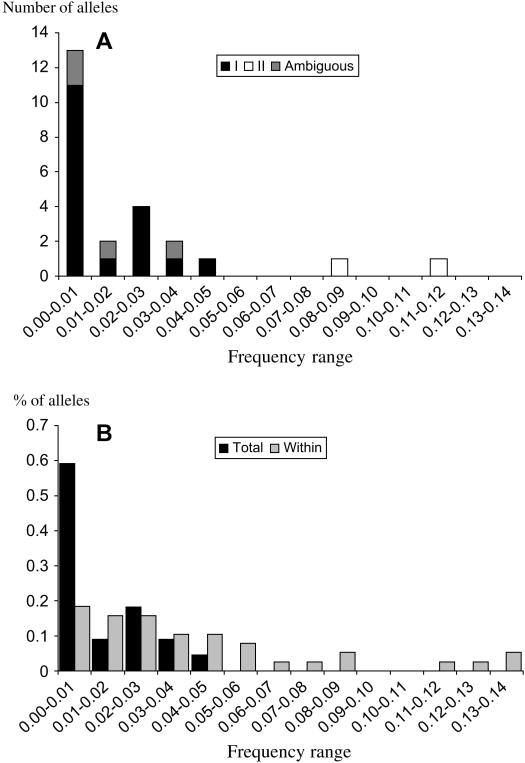
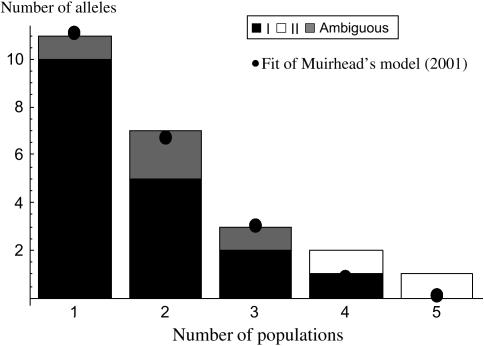
Self-incompatibility (SI) systems are widespread mechanisms that prevent self-fertilization in angiosperms. They are generally encoded by one genome region containing several multiallelic genes, usually called the S-locus. They involve a recognition step between the pollen and the pistil component and pollen is rejected when it shares alleles with the pistil. The direct consequence is that rare alleles are favored, such that the S-alleles are subject to negative frequency-dependent selection. Several theoretical articles have predicted the specific patterns of polymorphism, compared to neutral loci, expected for such genes under balancing selection. For instance, many more alleles should be maintained and populations should be less differentiated than for neutral loci. However, empirical tests of these predictions in natural populations have remained scarce. Here, we compare the genetic structure at the S-locus and microsatellite markers for five natural populations of the rare species Brassica insularis. As in other Brassica species, B. insularis has a sporophytic SI system for which molecular markers are available. Our results match well the theoretical predictions and constitute the first general comparison of S-allele and neutral polymorphism.


Figures

Figure 1.
Figure 1.
Distribution of the five Corsican populations of Brassica insularis studied. Open circles indicate other known populations, not studied here.
Figure 2.
Figure 2.
Genotyping of individuals by IEF and Western blotting. The Western blot membrane was first immunostained with the anti-class I antibody (up) and then with the anti-class II antibody (down). Isoelectric point (pI) markers are indicated on the left. Each arrow corresponds to one allele (five class I and two class II in all). Because of possible multiple glycosylation patterns on the same SLG, one allele can correspond to several bands. The occurrence of two class II alleles and not only one has been verified on other blots.
Figure 3.
Figure 3.
Rules of attribution of the IEF profiles observed for the four possible genotypes. Ii, class I allele; IIk, class II allele; Am, ambiguous allele; ?, no detection. Thin lines, unambiguous attributions, identical under the three assumptions. Thick solid lines, lowest estimates. Dashed lines, highest and intermediate estimates. These two assumptions differ for attributions indicated by the asterisk (see main text).
Figure 4.
Figure 4.
Number of S-alleles detected and estimated (three estimates) as a function of θ estimated under the SMM hypothesis. Diamonds, number detected; circles, lowest estimate; crosses, intermediate estimate; plus signs, highest estimate. The four regression lines are also given, bottom to top, from the detected number to the highest estimate.
Figure 5.
Figure 5.
Pairwise FST at the S-locus as a function of the FST for microsatellites. The solid line indicates equality. FST's at the S-locus were computed assuming no class II homozygotes (solid diamonds) or that all II/? profiles were homozygous (open diamonds). The circled diamonds correspond to FST pairs involving Punta Calcina.
Figure 6.
Figure 6.
Frequency spectrum of the S-alleles (A) across all the populations and (B) within a population. In B, the two class II alleles are excluded and the ambiguous alleles are pooled with the class I alleles. The frequency spectrum is given here in percentage and not in absolute number of alleles because it is the mean over the five populations.
Figure 7.
Figure 7.
“Sharing distribution” of the S-alleles that is the number of alleles present in k populations. The solid circle corresponds to the fit of Muirhead's (2001) model (see the main text).

References

    1. Aguilar, A., G. Roemer, S. Debenham, M. Binns, D. Garcelon et al., 2004. High MHC diversity maintained by balancing selection in an otherwise genetically monomorphic mammal. Proc. Natl. Acad. Sci. USA 101: 3490–3494. - PMC - PubMed
    1. Aspinwall, N., and T. Christian, 1992. Pollination biology, seed production, and population structure in queen-of-the-prairie, Filipendula rubra (Rosaceae) at Botkin fen, Missouri. Am. J. Bot. 79: 488–494.
    1. Awadalla, P., and D. Charlesworth, 1999. Recombination and selection at Brassica self-incompatibility loci. Genetics 152: 413–425. - PMC - PubMed
    1. Bechsgaard, J., T. Bataillon and M. H. Schierup, 2004. Uneven segregation of sporophytic self-incompatibility alleles in Arabidopsis lyrata. J. Evol. Biol. 17: 554–561. - PubMed
    1. Bell, C. J., and J. R. Ecker, 1994. Assignment of 30 microsatellite loci to the linkage map of Arabidopsis. Genomics 19: 137–144. - PubMed

Publication types

Substances