Neural basis for a powerful static motion illusion
- PMID: 15944393
- PMCID: PMC1431688
- DOI: 10.1523/JNEUROSCI.1084-05.2005
Neural basis for a powerful static motion illusion
Abstract
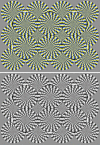
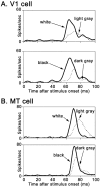
Most people see movement in Figure 1, although the image is static. Motion is seen from black --> blue --> white --> yellow --> black. Many hypotheses for the illusory motion have been proposed, although none have been tested physiologically. We found that the illusion works well even if it is achromatic: yellow is replaced with light gray, and blue is replaced with dark gray. We show that the critical feature for inducing illusory motion is the luminance relationship of the static elements. Illusory motion is seen from black --> dark gray --> white --> light gray --> black. In psychophysical experiments, we found that all four pairs of adjacent elements when presented alone each produced illusory motion consistent with the original illusion, a result not expected from any current models. We also show that direction-selective neurons in macaque visual cortex gave directional responses to the same static element pairs, also in a direction consistent with the illusory motion. This is the first demonstration of directional responses by single neurons to static displays and supports a model in which low-level, first-order motion detectors interpret contrast-dependent differences in response timing as motion. We demonstrate that this illusion is a static version of four-stroke apparent motion.
Figures


Similar articles
-
Going with the Flow: The Neural Mechanisms Underlying Illusions of Complex-Flow Motion.J Neurosci. 2019 Apr 3;39(14):2664-2685. doi: 10.1523/JNEUROSCI.2112-18.2019. Epub 2019 Feb 18. J Neurosci. 2019. PMID: 30777886 Free PMC article.
-
Illusory motion from change over time in the response to contrast and luminance.J Vis. 2005 Dec 30;5(11):1055-69. doi: 10.1167/5.11.10. J Vis. 2005. PMID: 16441202
-
Representation of illusory and physical rotations in human MST: A cortical site for the pinna illusion.Hum Brain Mapp. 2016 Jun;37(6):2097-113. doi: 10.1002/hbm.23156. Epub 2016 Mar 4. Hum Brain Mapp. 2016. PMID: 26945511 Free PMC article.
-
Perceptual filling-in: More than the eye can see.Prog Brain Res. 2006;154:227-45. doi: 10.1016/S0079-6123(06)54012-9. Prog Brain Res. 2006. PMID: 17010714 Review.
-
Why do parallel cortical systems exist for the perception of static form and moving form?Percept Psychophys. 1991 Feb;49(2):117-41. doi: 10.3758/bf03205033. Percept Psychophys. 1991. PMID: 2017350 Review.
Cited by
-
Anomalous motion illusion contributes to visual preference.Front Psychol. 2012 Nov 29;3:528. doi: 10.3389/fpsyg.2012.00528. eCollection 2012. Front Psychol. 2012. PMID: 23226138 Free PMC article.
-
Illusory Motion Perception Is Associated with Contrast Discrimination but Not Motion Sensitivity, Self-Reported Visual Discomfort, or Migraine Status.Invest Ophthalmol Vis Sci. 2020 Jul 1;61(8):43. doi: 10.1167/iovs.61.8.43. Invest Ophthalmol Vis Sci. 2020. PMID: 32725212 Free PMC article.
-
Do fish perceive illusory motion?Sci Rep. 2014 Sep 23;4:6443. doi: 10.1038/srep06443. Sci Rep. 2014. PMID: 25246001 Free PMC article.
-
Illusory visual motion stimulus elicits postural sway in migraine patients.Front Psychol. 2015 Apr 28;6:542. doi: 10.3389/fpsyg.2015.00542. eCollection 2015. Front Psychol. 2015. PMID: 25972832 Free PMC article.
-
Do rhesus monkeys (Macaca mulatta) perceive illusory motion?Anim Cogn. 2015 Jul;18(4):895-910. doi: 10.1007/s10071-015-0860-6. Epub 2015 Mar 27. Anim Cogn. 2015. PMID: 25812828 Free PMC article.
References
-
- Anstis SM (1970) Phi movement as a subtraction process. Vision Res 10: 1411-1430. - PubMed
-
- Anstis SM, Rogers BJ (1975) Illusory reversal of visual depth and movement during changes of contrast. Vision Res 15: 957-961. - PubMed
-
- Anstis SM, Rogers BJ (1986) Illusory continuous motion from oscillating positive-negative patterns: implications for motion perception. Perception 15: 627-640. - PubMed
-
- Braddick OJ (1980) Low-level and high-level processes in apparent motion. Philos Trans R Soc Lond B Biol Sci 290: 137-151. - PubMed
Publication types
MeSH terms
Grants and funding
LinkOut - more resources
Full Text Sources
