

doi: 10.1364/ol.30.001159.
Ball lens coupled fiber-optic probe for depth-resolved spectroscopy of epithelial tissue
Affiliations
- PMID: 15945140
- PMCID: PMC2773162
- DOI: 10.1364/ol.30.001159
Item in Clipboard
Ball lens coupled fiber-optic probe for depth-resolved spectroscopy of epithelial tissue
Opt Lett.
.
Abstract
A ball lens coupled fiber-optic probe design is described for depth-resolved measurements of the fluorescence and reflectance properties of epithelial tissue. A reflectance target, fluorescence targets, and a two-layer tissue phantom consisting of fluorescent microspheres suspended in collagen are used to characterize the performance of the probe. Localization of the signal to within 300 microm of the probe tip is observed by use of reflectance and fluorescence targets in air. Differential enhancement of the fluorescence signal from the top layer of the two-layer tissue phantom is observed.
Figures

(a) Ball lens coupled probe, showing illumination ray paths (solid lines) and collection region (dashed lines). A typical epithelial thickness of 300 µm is shown for reference. (b) Angular deviation of a ray incident parallel to the probe axis.
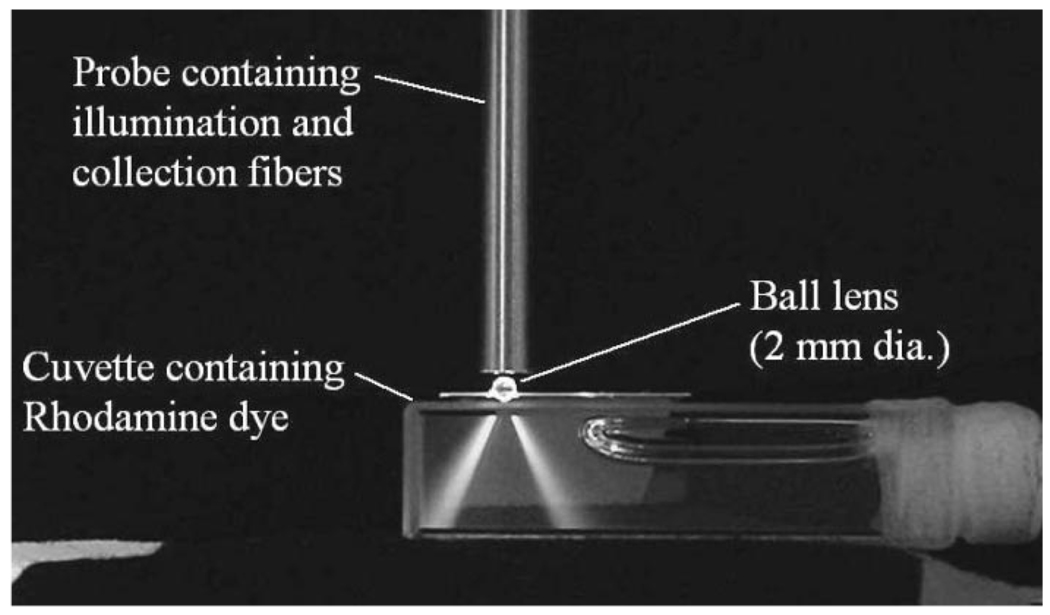
Photograph of the ball lens coupled probe illuminating a cuvette containing the fluorescent dye Rhodamine.

Normalized reflectance signal as a function of probe-to-target distance. Source–detector separation and illumination wavelength are noted. Half-maximum intensity occurs at an average distance of 136 µm (for 750-µm separation) or 340 µm (for 500-µm separation).
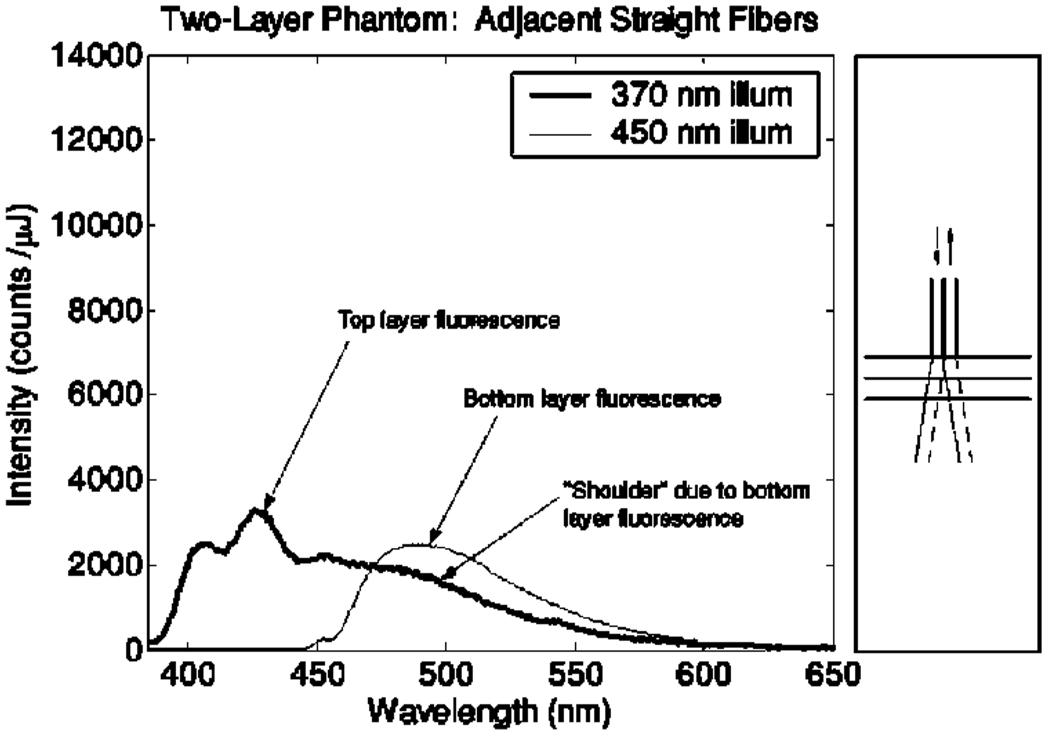
Two-layer tissue phantom fluorescence data: straight fiber probe at a minimum source–detector separation (250 µm), corrected for excitation energy.

Two-layer tissue phantom fluorescence data: ball lens coupled probe with a 2-mm-diameter ball lens and 750-µm source–detector separation, corrected for excitation energy.
Similar articles
-
Effect of fiber optic probe geometry on depth-resolved fluorescence measurements from epithelial tissues: a Monte Carlo simulation.J Biomed Opt. 2003 Apr;8(2):237-47. doi: 10.1117/1.1559058. J Biomed Opt. 2003. PMID: 12683849
-
Effects of fiber-optic probe design and probe-to-target distance on diffuse reflectance measurements of turbid media: an experimental and computational study at 337 nm.Appl Opt. 2004 May 10;43(14):2846-60. doi: 10.1364/ao.43.002846. Appl Opt. 2004. PMID: 15143808 Free PMC article.
-
Autofluorescence and diffuse reflectance spectroscopy of oral epithelial tissue using a depth-sensitive fiber-optic probe.Appl Opt. 2008 Feb 20;47(6):825-34. doi: 10.1364/ao.47.000825. Appl Opt. 2008. PMID: 18288232 Free PMC article.
-
Fiber optic probes for biomedical optical spectroscopy.J Biomed Opt. 2003 Jan;8(1):121-47. doi: 10.1117/1.1528207. J Biomed Opt. 2003. PMID: 12542388 Review.
-
Fiber optic in vivo imaging in the mammalian nervous system.Curr Opin Neurobiol. 2004 Oct;14(5):617-28. doi: 10.1016/j.conb.2004.08.017. Curr Opin Neurobiol. 2004. PMID: 15464896 Free PMC article. Review.
Cited by
-
Prospective evaluation of a portable depth-sensitive optical spectroscopy device to identify oral neoplasia.Biomed Opt Express. 2010 Dec 8;2(1):89-99. doi: 10.1364/BOE.2.000089. Biomed Opt Express. 2010. PMID: 21326639 Free PMC article.
-
Analytical light reflectance models for overlapping illumination and collection area geometries.Appl Opt. 2012 Nov 20;51(33):8013-21. doi: 10.1364/AO.51.008013. Appl Opt. 2012. PMID: 23207312 Free PMC article.
-
Depth-selective fiber-optic probe for characterization of superficial tissue at a constant physical depth.Biomed Opt Express. 2011 Mar 14;2(4):838-49. doi: 10.1364/BOE.2.000838. Biomed Opt Express. 2011. PMID: 21483607 Free PMC article.
-
Fiber-optic Raman probe couples ball lens for depth-selected Raman measurements of epithelial tissue.Biomed Opt Express. 2010 Jun 28;1(1):17-30. doi: 10.1364/BOE.1.000017. Biomed Opt Express. 2010. PMID: 21258442 Free PMC article.
-
Detection of precancerous lesions in the oral cavity using oblique polarized reflectance spectroscopy: a clinical feasibility study.J Biomed Opt. 2017 Jun 1;22(6):65002. doi: 10.1117/1.JBO.22.6.065002. J Biomed Opt. 2017. PMID: 28609512 Free PMC article.
References
-
- Wagnieres GA, Star WM, Wilson BC. Photochem. Photobiol. 1998;68:603. - PubMed
-
- Drezek R, Sokolov K, Utzinger U, Boiko I, Malpica A, Follen M, Richards-Kortum R. J. Biomed. Opt. 2001;6:385. - PubMed
-
- Pfefer TJ, Matchette LS, Ross AM, Ediger MN. Opt. Lett. 2003;28:120. - PubMed
-
- Utzinger U, Richards-Kortum R. J. Biomed. Opt. 2003;8:121. - PubMed
-
- Amelink A, Bard MPL, Burgers SA, Sterenborg HJCM. Appl. Opt. 2003;42:4095. - PubMed
Publication types
MeSH terms
Grants and funding
LinkOut - more resources
Full Text Sources
Other Literature Sources
