. 2005 Sep 1;567(Pt 2):523-43.
doi: 10.1113/jphysiol.2005.087973. Epub 2005 Jun 9.

Confocal imaging of [Ca2+] in cellular organelles by SEER, shifted excitation and emission ratioing of fluorescence

Affiliations

Confocal imaging of [Ca2+] in cellular organelles by SEER, shifted excitation and emission ratioing of fluorescence

Bradley S Launikonis et al. J Physiol. .

Abstract

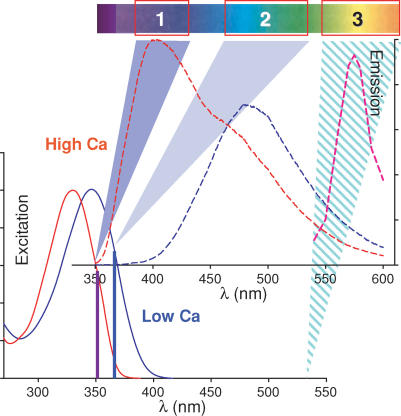
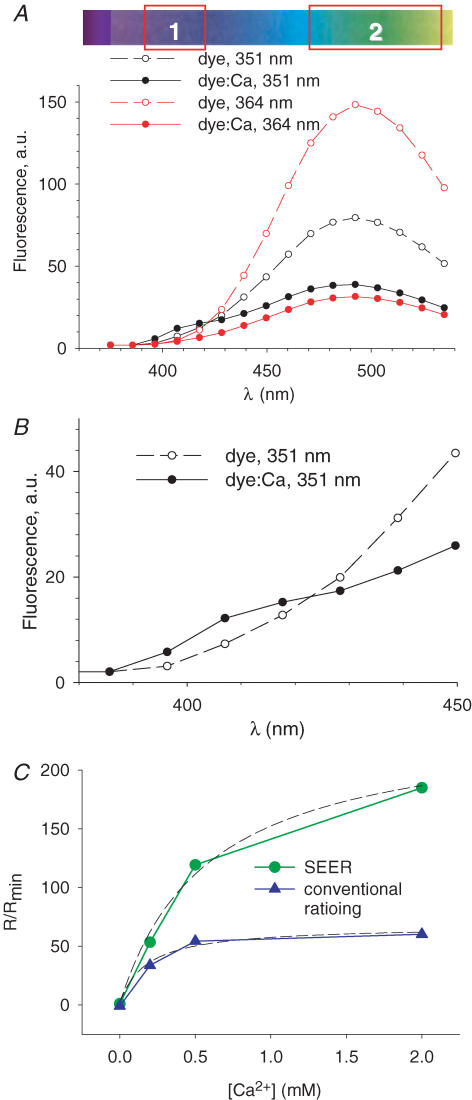
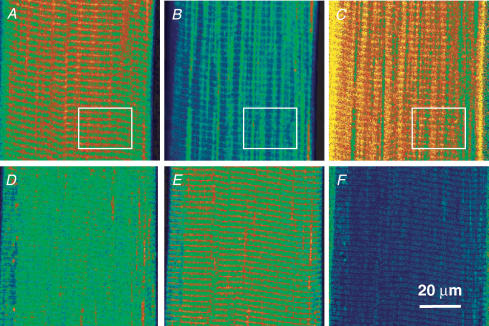
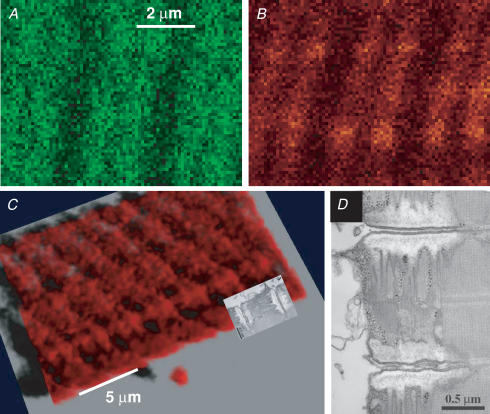
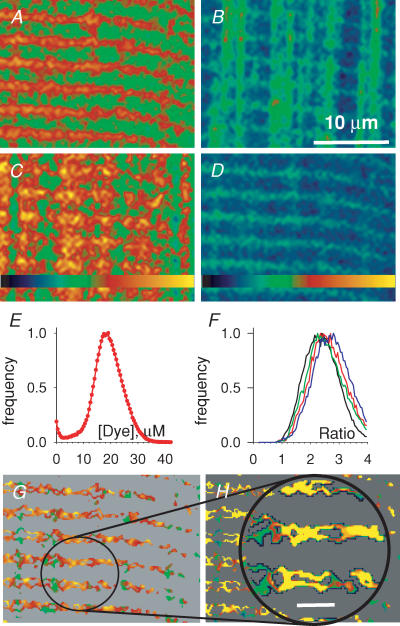
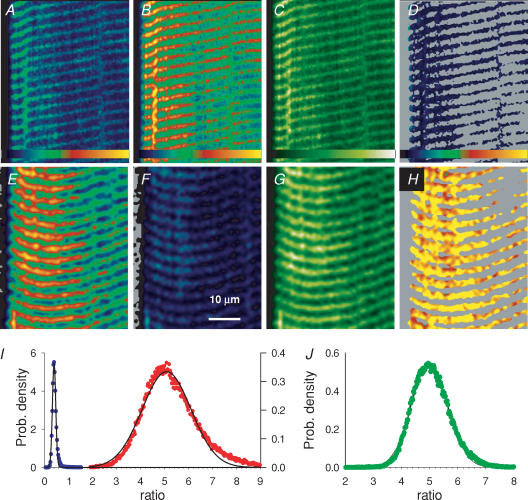
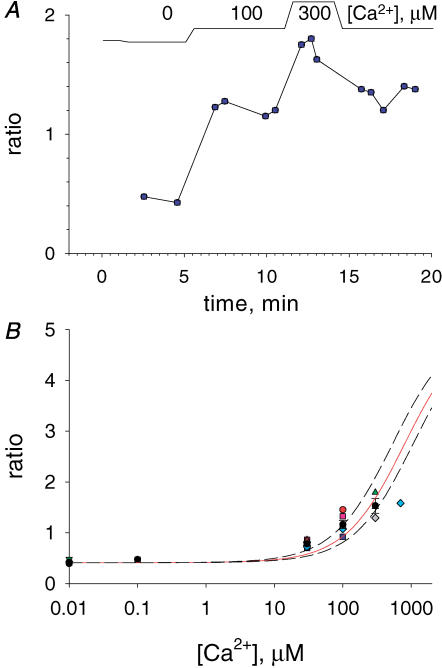
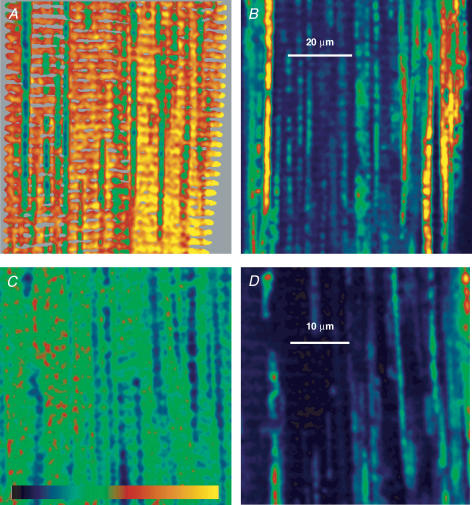
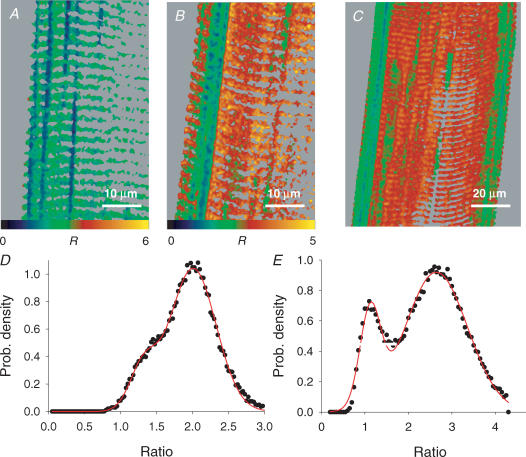
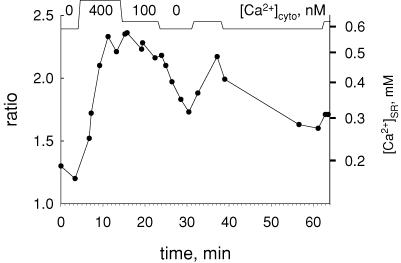
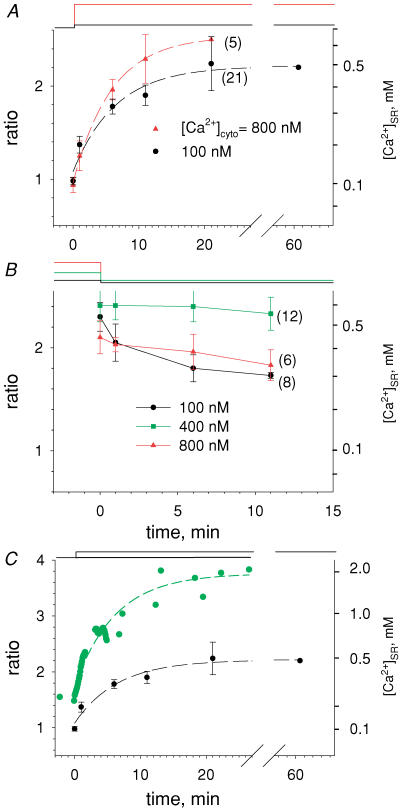
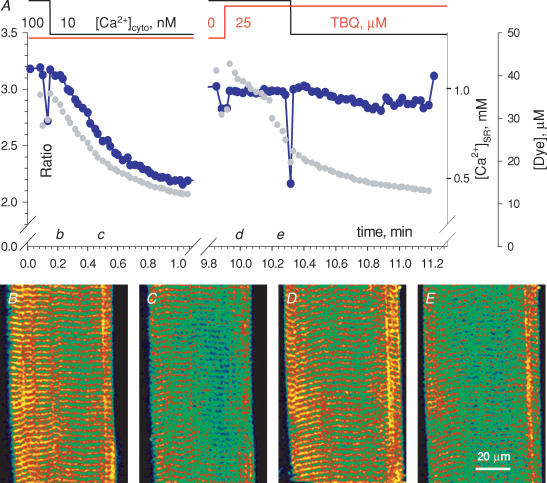
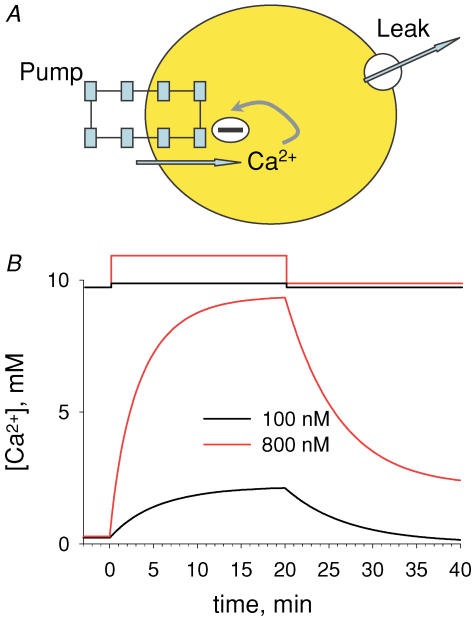
Intracellular calcium signals regulate multiple cellular functions. They depend on release of Ca2+ from cellular stores into the cytosol, a process that appears to be tightly controlled by changes in [Ca2+] within the store. A method to image free [Ca2+] within cellular organelles was devised, which provided the first quantitative confocal images of [Ca2+] inside the sarcoplasmic reticulum (SR) of skeletal muscle. The method exploits, for greater sensitivity, the dual spectral shifts that some fluorescent dyes undergo upon binding Ca2+. It was implemented with mag-indo-1 trapped in the intracellular organelles of frog skeletal muscle and validated showing that it largely monitors [Ca2+] in a caffeine-sensitive compartment with the structure of the SR cisternae. A tentative calibration in situ demonstrated an increase in the dye's dissociation constant, not unlike that observed for other dyes in cellular environments. This increase, together with other characteristics of the ratioing method, placed the half-signal [Ca2+] near 1 mM, a value suitable for cellular stores. Demonstrated advantages of the technique include accuracy (that of a calibrated ratiometric method), dynamic range and sensitivity (from the combination of two spectral shifts), spatial and temporal resolution, and compatibility with a vast array of visible dyes to monitor diverse aspects of cellular function. SEER (shifted excitation and emission ratioing) also provides a [Ca2+]-independent measure of dye concentration in the cell. Store and mitochondrial [Ca2+] ([Ca2+]SR and [Ca2+]mito could be measured separately using the high spatial resolution of SEER. Evolution of [Ca2+]SR was followed upon changes in cytosolic [Ca2+] ([Ca2+]cyto). At [Ca2+]cyto = 100 nM, [Ca2+]mito remained near the lower limit of detection and [Ca2+]SR stabilized at values that were submillimolar according to our tentative calibration. Steady [Ca2+]SR was only slightly higher in 800 nM [Ca2+]cyto, and essentially did not decrease unless [Ca2+]cyto was reduced below 10 nM. While the increase of [Ca2+]SR was limited by loss through Ca2+ release channels, its decrease in low [Ca2+]cyto was largely dependent on leaks through the SR Ca2+ pump.


Figures

Figure 1
Figure 1. The basis of SEER
Fluorescence excitation and emission spectra of Ca2+-free (blue trace) or Ca2+-bound dye (red) determined by spectrofluorometry. Vertical violet and blue lines mark the position on excitation spectra of the argon laser lines (1, at 351 nm and 2, at 364 nm) used in SEER. Boxes 1 and 2 on the rainbow bar at top indicate the fluorescence emission ranges collected for images to be ratioed. The conventional practice would be to divide F11 (obtained with excitation 1 in emission range 1) by F12 (obtained with excitation 1 in emission range 2). By contrast, the SEER ratio is defined as F11/F22. Box 3 marks the collection range for fluorescence F33 of rhod-2, excited at 543 nm, with emission spectrum in pink. Spectral curves reproduced with modifications from http://www.probes.com/servlets/spectra?fileid=1202ca
Figure 2
Figure 2. Spectra and calibration in solution
A, emission spectra measured with the experimental laser scanning microscope, aqueous solutions and chambers. Each point corresponds to emission in successive 10 nm-wide wavelength bands, recorded in solutions with 25 μm mag-indo-1, either free (open symbols), or saturated with Ca2+, excited at 351 nm (black) or 364 nm (red). B, data for 351 nm excitation on an expanded wavelength scale, showing an isosbestic point at 425 nm. The ranges represented by boxes 1 and 2 in the diagram at top represent the ranges used for measurements in cells, which did not agree in detail with the optimal ranges in solution. C, titration of the dye by Ca2+. Blue symbols: conventional emission ratios, namely ratios of fluorescence F11 (excited at 351 nm in the 10 nm emission range centred at 408 nm) and fluorescence F12 (excited at 351 nm in the 10 nm emission range centred at 492 nm). Green symbols: SEER ratioing, namely fluorescence F11 divided by F22, which is excited at 364 nm in the emission range centred at 492 nm. Dashed curves: best fits by eqn (8), with free parameters Rmax/Rmin (the asymptotic value) and KD, the mid-signal concentration. Note that both parameters are more than 3 times greater with SEER.
Figure 3
Figure 3. Validation of SEER
A and B, individual images F11(x,y) and F22(x,y) from a mag-indo-1-stained cell after 30 min in the ‘loading’ solution. C, ratio of A and B. D and E, corresponding images, and F, their ratio, after 2 min in release cocktail. The spatial aspects reverse upon depletion, with transversal structures of high fluorescence in F11 (A) losing their fluorescence after depletion, but gaining high fluorescence in F22 (E). Boxed areas in AC are reproduced in Fig. 5 for further analysis. Identifiers: 120903b 445 and 451.
Figure 4
Figure 4. Spatial resolution of SEER imaging with mag-indo-1
A and B, averages of four images F11 and F22 at high spatial resolution in a cell with empty store. The sacs are transversal to the fibre axis. C, 3-D rendering of a stack of 15 F22xy scans in same cell, deblurred to improve resolution (see Methods). The transversal structure of high staining is rendered as sacs in doublets. D, electron micrograph of thin section of guppy muscle, superimposed in C at the appropriate scale to show correspondence between the stained structure and SR terminal cisternae. Identifier: 072004a 98. Image D (from Franzini-Armstrong, 1999) was kindly provided by C. Franzini-Armstrong.
Figure 5
Figure 5. The distribution of dye in a stained cell
A–C, images F11(x,y), F22(x,y) and their ratio R, from a cell with loaded store (same as boxed portions of panels A–C in Fig. 3). D, dye concentration DT (x,y), derived by linear combination of F11 and F22 (eqn (A12)). E, all-pixel histogram of DT (x,y), which is distributed uni-modally around ∼20 μm. F, the histograms of R in regions with different DT. Each curve corresponds to areas (x,y) where DT is in each of the four quartiles of the distribution depicted in E. As DT increases, R adopts slightly greater values. G, ratio, in same colour scale as in C, but restricted to the well-stained regions (upper quartile). H, [Ca2+] derived from G by eqn (1), showing the characteristic doublet structure of SR terminal cisternae. Horizontal bar in magnified area is 2 μm. Colour tables span the range 0–255 for A and B, 0–3.5 for C and E; 0–40 μm for D; 0–700 μm for F. Identifier: 120903b 445.
Figure 6
Figure 6. Calibrations in situ
A and B, F11(x,y) and F22(x,y) images, respectively, from a cell with permeabilized SR exposed to a nominally Ca2+-free solution. C, DT(x,y), derived from A and B by eqn (A12). D, R=F11/F22, masked to areas in the two upper quartiles of the distribution of DT (‘dye-restricted masking’). Identifier: 031605c_008. E and F, images F11 and F22, respectively, from a cell with intact SR, exposed to an internal solution with 30 μm[Ca2+] and 0.5 mm tetracaine. G, DT(x,y), derived from E and F. H, ratio image, from E and F, masked to the two top quartiles of the distribution of DT. Identifier: 031505c_014. Colour tables span the range 0–255 for A, B, E and F; 0–50 μm for C and G; 0–4.25 for D and H. I, histograms of the ratio images D (blue) and H (red), with gaussian fits (lines) of means 0.406 and 5.080. J, histogram of the ratio image from a fibre stained with indo-1 and treated as described for E–H. Gaussian fit (line) has mean of 4.98. Identifier: 31805a_024.
Figure 7
Figure 7. Calibrations in situ
A, evolution of mean ratio (RSR) in a fibre with permeabilized SR exposed to different [Ca2+]cyto as depicted in top diagram. Identifier: 031605b. B, summary results. Each symbol represents the average of RSR in all images at the same [Ca2+]cyto in the same experiment. Different types of symbols represent different fibres (n = 10). Continuous curve: best fit with eqn (1). The point at 0.7 mm[Ca2+] (diamond) is an average of values that decayed during the experiment and was not included in the fit. Best fit parameters: Rmin= 0.410, γKD= 802 μm. Rmax was set to 5.08. Curves in dashed trace follow eqn (1) with the same Rmin and Rmax, and γKD= 536 or 1068 μm.
Figure 8
Figure 8. SEER resolves mitochondria
A, ratio image of a cell loaded with mag-indo-1 and rhod-2, then membrane-permeabilized and immersed in a 100 nm [Ca2+] solution. (Image is masked to the three upper quartiles of DT.) B, simultaneously acquired image of rhod-2 fluorescence. Note detailed correspondence between low [Ca2+] regions in A and rhod-2 stained mitochondria in B, but greater heterogeneity in mitochodrial staining by rhod-2. Identifier: 022504a_11. C, ratio image of a cell loaded with mag-indo-1, membrane-permeabilized and exposed to a cytosolic solution with 100 nm[Ca2+] and Mitrotracker green. D, simultaneously acquired image of Mitotracker fluorescence. Again, there is detailed correspondence between mitochondrial staining by Mitotracker and regions of low [Ca2+] in C. Identifier:092403b_9. Colour table spans the range 0–3.5 for A and C; 0–255 for B and D.
Figure 9
Figure 9. SR loading at elevated [Ca2+]cyto
A, ratio image after 30 s loading in 100 nm[Ca2+]cyto. Image masked to two upper quartiles of DT. Note mitochondria in superficial region. B, image in different region of same cell, after 60 s in 400 nm[Ca2+]cyto. C, image obtained immediately after B, at lower magnification, to show ‘cuff’ of mitochondria. D and E, histograms of ratio in images A and B. Lines, best fits by sum of two gaussian terms of means Rm and RSR. Mean values were: for A, Rm= 1.20, RSR= 2.02; for B, Rm= 1.12, RSR= 2.64. Identifiers: 051904a_14, 26 and 27.
Figure 10
Figure 10. Evolution of [Ca2+]SR upon changes in [Ca2+]cyto
Time course of mean ratio RSR in successive images, while [Ca2+]cyto was changed as depicted at top. Intervals labelled ‘0’ were spent in relaxing solution. [Ca2+]SR on right axis calculated from ratio values according to eqn (1) with parameters listed in legend of Fig. 7. Note very slow decay of [Ca2+]SR upon change to 100 nm[Ca2+]cyto, and rapid decay in relaxing solution. Identifier: 071504a.
Figure 11
Figure 11. Summary of the evolution of [Ca2+]SR
A, mean ratio RSR measured at set times after the change from relaxing solution (less than 10 nm[Ca2]cyto) to 100 nm (black) or 800 nm (red), averaged over all comparable experiments (numbers in parentheses). Bars are s.e.m.[Ca2+]SR scaled calculated as described for Fig. 10. Dashed lines: exponential fits, with parameters given in the text. B, evolution of RSR after reducing [Ca2+]cyto as shown at top. Values from different experiments were averaged as described for A. Note that the changes from high [Ca2+]cyto (green and red) were to a 100 nm [Ca2+] solution, and led to a very slow reduction in [Ca2+]SR. The descent from 100 nm [Ca2+] (black) was to nominally Ca2+-free solution and resulted in faster decay of [Ca2+]SR. C, green symbols, evolution of [Ca2+]SR upon increase to 800 nm[Ca2+]cyto in the presence of 0.5 mm tetracaine. Ratio images obtained at intervals of 5 s. The asymptotic value of the exponential fit (dashed line), 3.76, corresponds to a 3-fold greater [Ca2+]SR than in the absence of tetracaine in 100 nm Ca2+ (black) or 800 nm Ca2+ (Panel B). Identifier: 031505a_s12.
Figure 12
Figure 12. SR leak pathways include the pump
A, evolution of RSR (blue), [Ca2+]SR (scale at right) and DT (grey) upon changing the cytosolic solution from 100 nm to one nominally Ca2+-free. Upon the first change, [Ca2+]SR fell rapidly. A second change, after exposing the cell to TBQ, failed to induce decay of [Ca2+]SR. Sets of images obtained every 1.6 s. B–E, images DT(x,y) at times b–e (calculated by eqn (A12)) showing the bleaching effects of repeated imaging at high frequency. Identifier: 031105b, series 14 and 19.
Figure 13
Figure 13. Pump–leak model of evolution of [Ca2+]SR
A depicts an SR model compartment with a pump and a leak pathway. B, evolution of [Ca2+]SR upon changes in [Ca2+]cyto represented at top of panel. Properties of pump and leak are given in Methods. Both calculations started in the nominally [Ca2+]-free and ATP-free relaxing solution, modelled as having [Ca2+]= 10 nm and [ATP]= 1 μm. To simulate experimental changes, after 100 nm[Ca2+] the system was returned to values representing the relaxing solution. After 800 nm[Ca2+] the system was changed to 100 nm[Ca2+].

Similar articles

Cited by

References

    1. Agard DA, Hiraoka Y, Shaw P, Sedat JW. Fluorescence microscopy in three dimensions. Meth Cell Biol. 1989;30:353–377. - PubMed
    1. Art J. Photon detectors for confocal microscopy. In: Pawley JB, editor. Handbook of Biological Confocal Microscopy. 2nd. New York: Plenum Press; 1995. pp. 189–190.
    1. Baird GS, Zacharias DA, Tsien RY. Circular permutation and receptor insertion within green fluorescent proteins. Proc Natl Acad Sci U S A. 1999;96:11241–11246. - PMC - PubMed
    1. Berridge MJ, Bootman MD, Roderick HL. Calcium signalling: dynamics, homeostasis and remodelling. Nat Rev Mol Cell Biol. 2003;4:517–529. - PubMed
    1. Bevington PR, Robinson DK. Data Reduction and Error Analysis. Boston: Mc Graw Hill; 2003. pp. 43–44.

Publication types

MeSH terms