. 2005 Jun 10:6:90.
doi: 10.1186/1471-2164-6-90.

Inferring yeast cell cycle regulators and interactions using transcription factor activities

Affiliations

Inferring yeast cell cycle regulators and interactions using transcription factor activities

Young-Lyeol Yang et al. BMC Genomics. .

Abstract

Background: Since transcription factors are often regulated at the post-transcriptional level, their activities, rather than expression levels may provide valuable information for investigating functions and their interactions. The recently developed Network Component Analysis (NCA) and its generalized form (gNCA) provide a robust framework for deducing the transcription factor activities (TFAs) from various types of DNA microarray data and transcription factor-gene connectivity. The goal of this work is to demonstrate the utility of TFAs in inferring transcription factor functions and interactions in Saccharomyces cerevisiae cell cycle regulation.

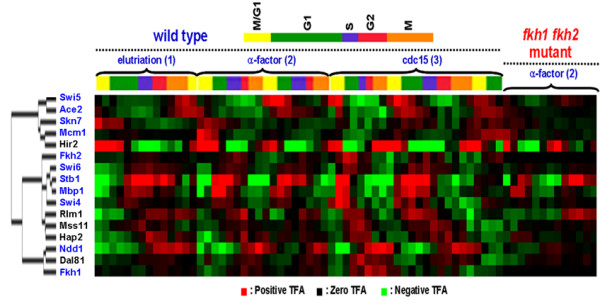
Results: Using gNCA, we determined 74 TFAs from both wild type and fkh1 fkh2 deletion mutant microarray data encompassing 1529 ORFs. We hypothesized that transcription factors participating in the cell cycle regulation exhibit cyclic activity profiles. This hypothesis was supported by the TFA profiles of known cell cycle factors and was used as a basis to uncover other potential cell cycle factors. By combining the results from both cluster analysis and periodicity analysis, we recovered nearly 90% of the known cell cycle regulators, and identified 5 putative cell cycle-related transcription factors (Dal81, Hap2, Hir2, Mss11, and Rlm1). In addition, by analyzing expression data from transcription factor knockout strains, we determined 3 verified (Ace2, Ndd1, and Swi5) and 4 putative interaction partners (Cha4, Hap2, Fhl1, and Rts2) of the forkhead transcription factors. Sensitivity of TFAs to connectivity errors was determined to provide confidence level of these predictions.

Conclusion: By subjecting TFA profiles to analyses based upon physiological signatures we were able to identify cell cycle related transcription factors consistent with current literature, transcription factors with potential cell cycle dependent roles, and interactions between transcription factors.


Figures

Figure 1
Figure 1
Flowchart summarizing our methodology. Flowchart of the method used to determine transcription factor functions and interactions.
Figure 2
Figure 2
Venn diagram of overlapped transcription factors among the four sub-networks analyzed. Each sub-network contains 40 transcription factors, but together, 74 Transcription factors can be used for determining TFAs. Sub-network 1, 2, 3, and 4 contains 1110, 847, 1015, and 793 genes, respectively. Total 1529 genes were finally selected for generating 4 multiple sub-networks from 1818 genes with full data points in the combined dataset.
Figure 3
Figure 3
Comparison of TFA profiles of 11 major yeast cell cycle related transcription factors between wild type and fkh1 fkh2 mutant. The first 3 columns corresponds to data deduced from yeast cultures synchronized by elutriation, α-factor arrest, and arrest of a cdc15 temperature-sensitive mutant which can give one cell cycle, two cell cycles, and three cell cycles for given experimental measurements, respectively. The last column corresponds to fkh1 fkh2 double knock-out mutant synchronized with α-factor arrest. Different stages in the cell cycle are indicated by the color code. Different colors in TFA profiles for each transcription factor represent TFAs from different sub-networks. S1, S2, S3 and S4 represent sub-networks 1, 2, 3, and 4, respectively.
Figure 4
Figure 4
Hierarchical clustering of TFAs of all 74 Transcription factors. Absolute correlation coefficient as a similarity measure and the average linkage method were used for clustering. Green, red, and black color represents negative log TFA ratios, positive log TFA ratios, and 0, respectively. The color intensity increases as the magnitude of each TFA value increases. The TFs denoted in blue are those TFs known to be involved in cell cycle.
Figure 5
Figure 5
Power spectra for selected TFAs from the 4 different sub-networks. (A) 11 known cell regulators. (B) The top 5 TFAs that exhibits periodic function. In both sub-figures, solid blue lines are the data deduced from yeast cultures synchronized by arrest of a cdc15 temperature-sensitive mutant, dash green lines are data deduced from yeast cultures synchronized by α-factor arrest, and dotted red lines are data collected from yeast cultures synchronized by elutriation.
Figure 6
Figure 6
TFA profiles of 5 putative cell cycle regulators. Details of the figure legends are the same as Figure 3.
Figure 8
Figure 8
Pearson correlation coefficients and the deviation coefficient for 11 known cell cycle factors (empty symbols) and other remaining 63 TFs (solid symbols) under the release from α-factor arrest. The oval encloses TFAs with both low deviation coefficient.
Figure 9
Figure 9
Phase diagrams of TFAs. (A) 11 known Transcription factors and (B) 5 deduced cell cycle-dependent factors.
Figure 7
Figure 7
Hierarchical clustering of TFA profiles of the 11 known cell cycle factors (blue) and the 5 putative cell cycle-dependent factors (black). TFs denoted in blue are those TFs known to be involved in cell cycle.

References

    1. Nelson DM, Ye X, Hall C, Santos H, Ma T, Kao GD, Yen TJ, Harper JW, Adams PD. Coupling of DNA synthesis and histone synthesis in S phase independent of cyclin/cdk2 activity. Mol Cell Biol. 2002;22:7459–7472. doi: 10.1128/MCB.22.21.7459-7472.2002. - DOI - PMC - PubMed
    1. Tran LM, Brynildsen MP, Kao KC, Suen JK, Liao JC. gNCA: a framework for determining transcription factor activity based on transcriptome: identifiability and numerical implementation. Metab Eng. 2005;7:128–141. doi: 10.1016/j.ymben.2004.12.001. - DOI - PubMed
    1. Liao JC, Boscolo R, Yang YL, Tran LM, Sabatti C, Roychowdhury VP. Network component analysis: reconstruction of regulatory signals in biological systems. Proc Natl Acad Sci U S A. 2003;100:15522–15527. doi: 10.1073/pnas.2136632100. - DOI - PMC - PubMed
    1. Wichert S, Fokianos K, Strimmer K. Identifying periodically expressed transcripts in microarray time series data. Bioinformatics. 2004;20:5–20. doi: 10.1093/bioinformatics/btg364. - DOI - PubMed
    1. Wang W, Cherry JM, Nochomovitz Y, Jolly E, Botstein D, Li H. Inference of combinatorial regulation in yeast transcriptional networks: a case study of sporulation. Proc Natl Acad Sci U S A. 2005;102:1998–2003. doi: 10.1073/pnas.0405537102. - DOI - PMC - PubMed

Publication types