. 2005 Sep;89(3):1681-91.
doi: 10.1529/biophysj.104.052837. Epub 2005 Jun 10.

Slowed N-type calcium channel (CaV2.2) deactivation by the cyclin-dependent kinase inhibitor roscovitine

Affiliations

Slowed N-type calcium channel (CaV2.2) deactivation by the cyclin-dependent kinase inhibitor roscovitine

Zafir Buraei et al. Biophys J. 2005 Sep.

Abstract

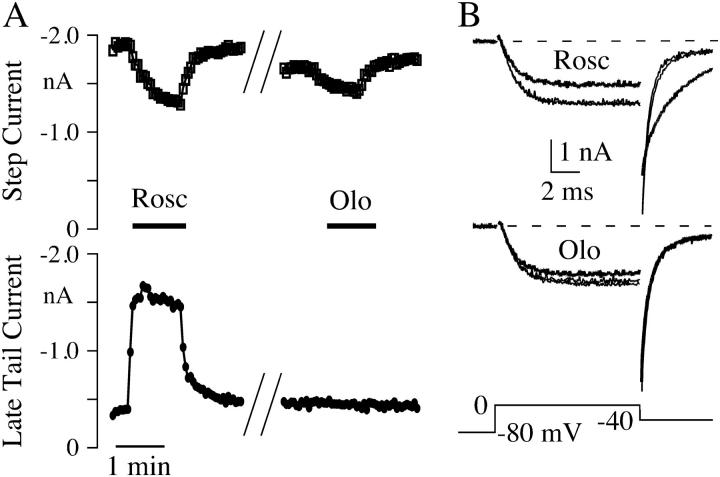
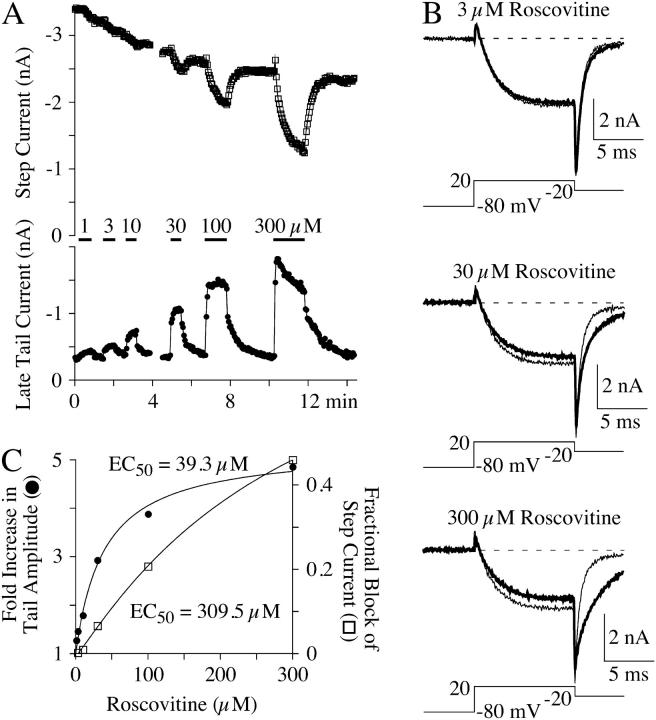
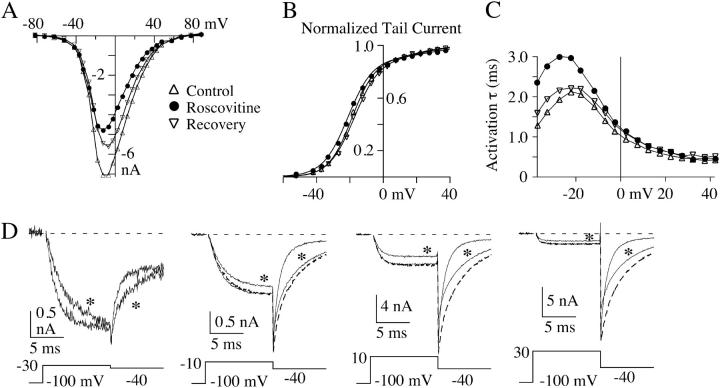
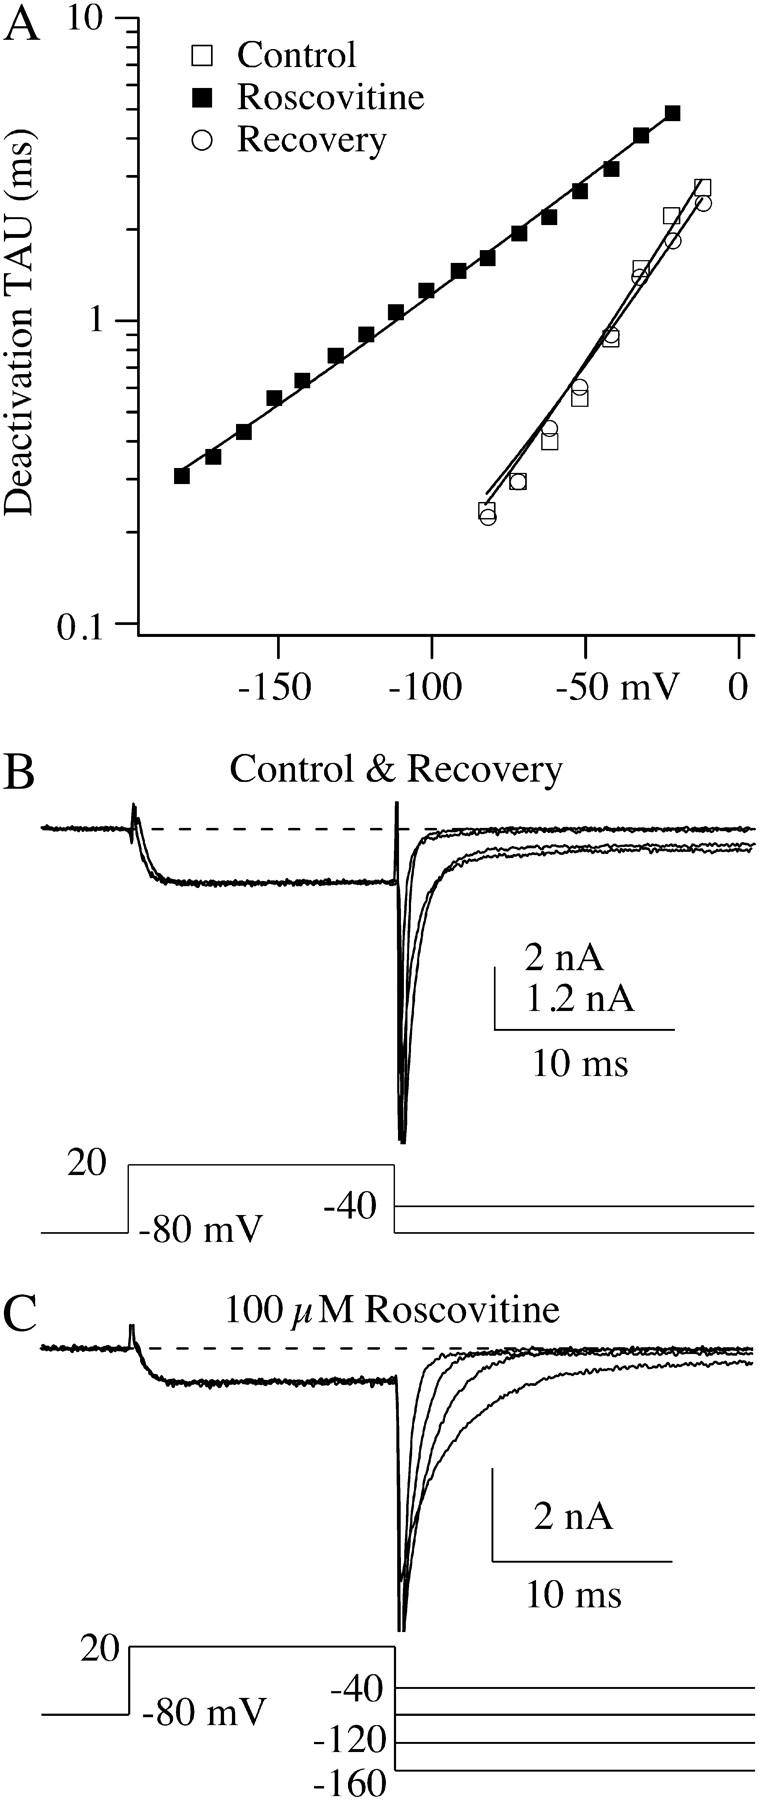
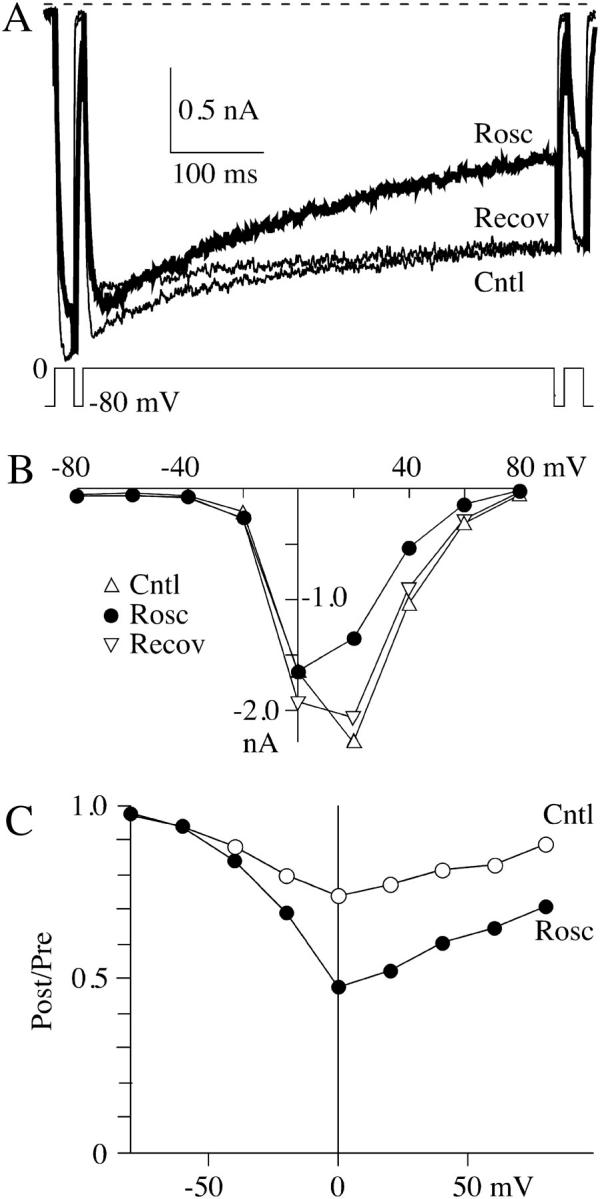
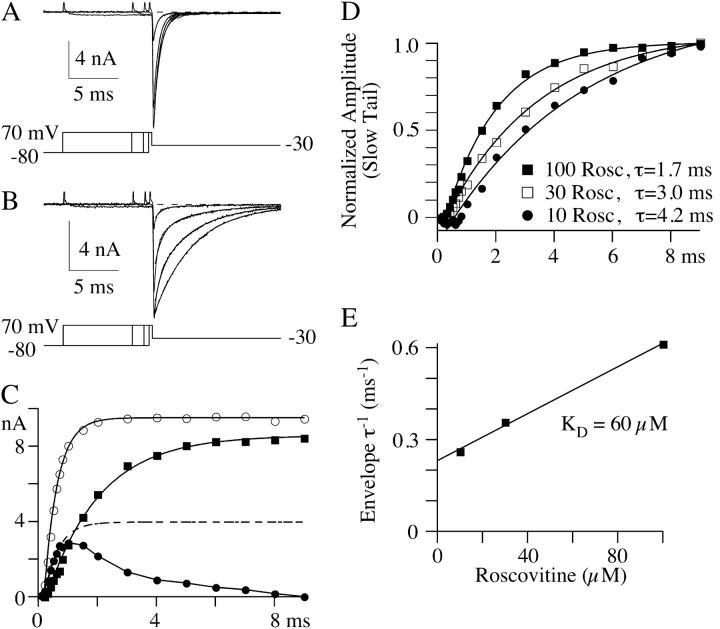
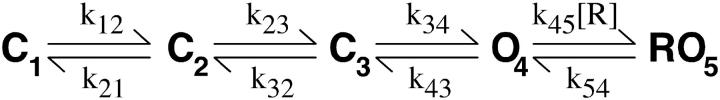
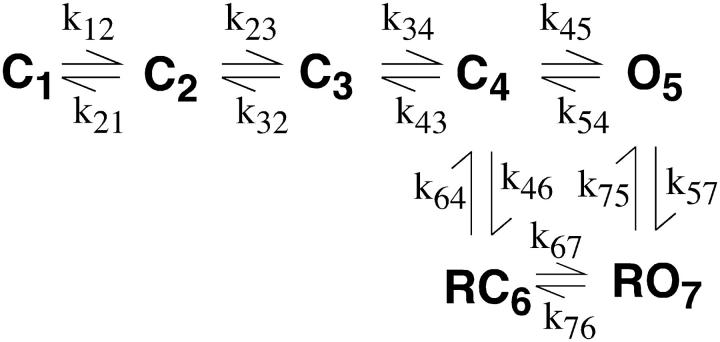
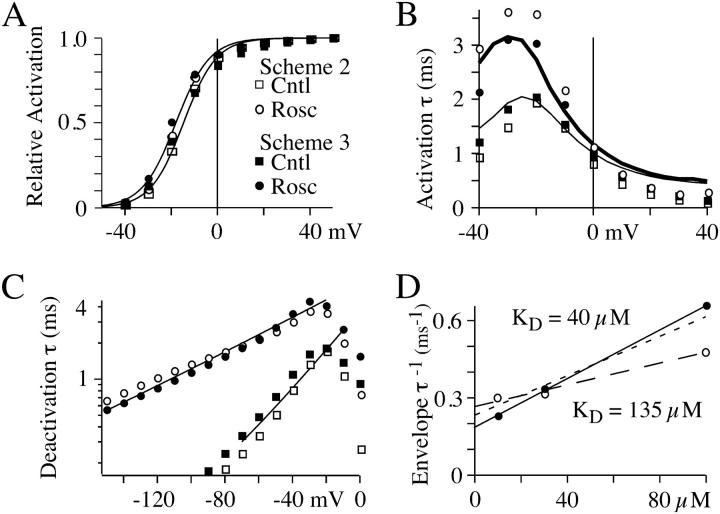
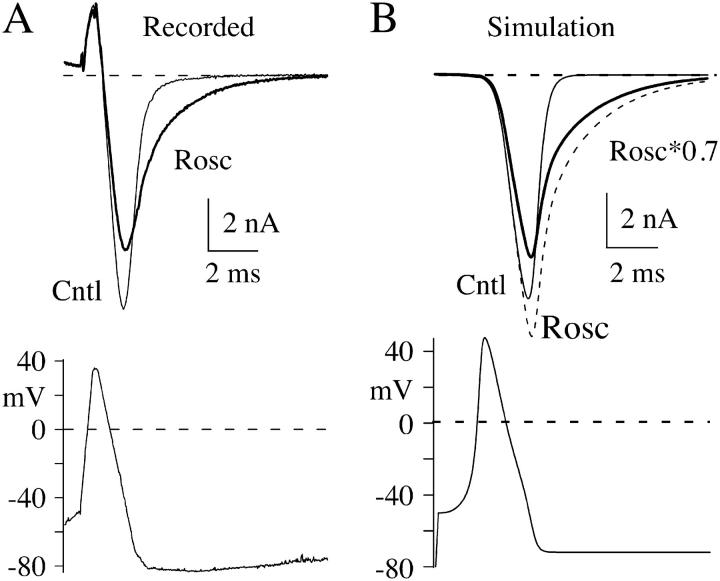
The lack of a calcium channel agonist (e.g., BayK8644) for CaV2 channels has impeded their investigation. Roscovitine, a potent inhibitor of cyclin-dependent kinases 1, 2, and 5, has recently been reported to slow the deactivation of P/Q-type calcium channels (CaV2.1). We show that roscovitine also slows deactivation (EC(50) approximately 53 microM) of N-type calcium channels (CaV2.2) and investigate gating alterations induced by roscovitine. The onset of slowed deactivation was rapid ( approximately 2 s), which contrasts with a slower effect of roscovitine to inhibit N-current (EC(50) approximately 300 microM). Slow deactivation was specific to roscovitine, since it could not be induced by a closely related cyclin-dependent kinase inhibitor, olomoucine (300 microM). Intracellularly applied roscovitine failed to slow deactivation, which implies an extracellular binding site. The roscovitine-induced slow deactivation was accompanied by a slight left shift in the activation-voltage relationship, slower activation at negative potentials, and increased inactivation. Additional data showed that roscovitine preferentially binds to the open channel to slow deactivation. A model where roscovitine reduced a backward rate constant between two open states was able to reproduce the effect of roscovitine on both activation and deactivation.


Figures

FIGURE 1
FIGURE 1
Roscovitine (Rosc) slows N-channel deactivation, but the closely related cdk inhibitor olomoucine (Olo) does not. (A) Currents generated in a 3 mM Ba2+ external solution show a decrease in step current amplitude (open squares) and a slowing of tail current deactivation in response to 100-μM roscovitine, but only the decreased step current in response to 300-μM olomoucine. Slow deactivation is measured as the amplitude of the late tail current (solid circles). (B) Currents before and upon recovery from roscovitine and olomoucine are shown (thin lines) along with the roscovitine- and olomoucine-affected currents (thick lines) in the top and bottom panels, respectively. All data from the same cell. The // in A indicates an approximately 3.5-min gap.
FIGURE 2
FIGURE 2
Dose-response relationships for the roscovitine-induced slow deactivation and step current inhibition. (A) Step current (upper panel) and late tail currents (lower panel) show the inhibition and slowed deactivation effects of roscovitine, respectively. The currents were measured as described in Materials and Methods. Note the slow inhibition of the late tail current after the initial enhancement during 300-μM roscovitine. (B) Example currents from the time course shown in A. The control currents are from the step just before roscovitine application and the currents in roscovitine (thick traces) are shown just before switching back to the control solution, except for 300-μM roscovitine, which shows the current at peak enhancement of the late tail current (∼9 s into the roscovitine application). (C) The maximal late tail enhancement (solid circles) and step current inhibition (open squares) from the same cell shown in A and B are plotted versus roscovitine concentration. The smooth lines are fits using single-site binding isotherms to yield the indicated half-maximal concentration (EC50).
FIGURE 3
FIGURE 3
Roscovitine induces small changes in N-current activation. The effect of 100-μM roscovitine (solid circles) is shown on the current-voltage relationship (A), the activation curve measured from tail currents (B), and τA (C) from a representative cell. The solid lines in B are double Boltzmann fits to the tail current activation curve. For the first Boltzmann, the V1/2 is −18.7, −20.9, and −17.3 mV, and the slope is e-fold for 7.0, 7.5, and 7.5 mV for control, roscovitine, and recovery, respectively, and for the second Boltzmann the respective values are V1/2 = 21.7, 30.5, and 23.6, and slope = 9.8, 12.2, and 10.4. For each fit the fractional amplitudes were held at 0.9 and 0.1 for the first and second components, respectively. (D) Currents from the same cell used for AC showing the slower activation at hyperpolarized voltages, the increased inhibition at more depolarized voltages, and slower deactivation after all voltage steps. The asterisks indicate current in roscovitine and the dashed current traces (−10 to +30 mV) are scaled roscovitine currents shown to permit comparisons of activation between control (thin traces) and roscovitine currents. Currents after recovery from roscovitine are not shown, but recovery is shown in AC. Outward currents at the onset of the depolarizing step have been blanked. These data were recorded in 3 mM Ba2+.
FIGURE 4
FIGURE 4
Roscovitine reduces the voltage dependence of deactivation. All data shown are from a representative cell. (A) τD measured from single-exponential fits to tail currents is plotted versus the tail voltage. Currents were activated by a 15-ms step to +20 mV, and the duration of the repolarization step was 20 ms. The y axis was log-transformed to highlight the decrease in deactivation voltage dependence. The smooth lines are single-exponential fits from which the voltage constant (ν) can be determined. In control and recovery ν = 26.3 mV and 28.9 mV, respectively. ν increased to 55.7 mV in 100-μM roscovitine. (B) Currents in control and after recovery from roscovitine are shown at two tail voltages (−40 and −80 mV). The recovery current is scaled to match that of control to facilitate comparison of the deactivation kinetics. The smaller scale value (1.2 nA) refers to the recovery current. (C) Tail currents in 100-μM roscovitine can be resolved to voltages as negative as −160 mV. Note that deactivation at −160 mV in roscovitine is slower than that at −80 mV in control.
FIGURE 5
FIGURE 5
Roscovitine increases N-channel inactivation. (A) A triple pulse protocol was used to examine the effect of roscovitine on inactivation. The prepulse and postpulse were 20-ms steps to 0 mV, whereas the 500-ms inactivation pulse was to voltages ranging from −80 to +80 mV (20-mV increments). The increased inactivation induced by 100 μM roscovitine can be observed during the 500-ms step to 0 mV. The external solution contained 30 mM Ba2+. (B) A plot of peak current measured during the 500-ms step versus the step voltage. The peak current was measured as the average ±2.5 ms around the peak. (C) The ratio of the postpulse current to prepulse current is plotted versus the inactivation step voltage. This relationship in control shows the characteristic U-shaped voltage dependence of N-current inactivation. The addition of 100-μM roscovitine increased inactivation at voltages >−40 mV. The voltage-generating maximal inactivation did not appear to be altered by roscovitine. Control was calculated as the average of the post-/pre- ratio before and upon recovery from roscovitine. The data in all panels are from the same cell.
FIGURE 6
FIGURE 6
N-channels must open before roscovitine can bind to affect deactivation kinetics. Currents generated during a tail current envelope paradigm are shown from the same cell in both control (A) and 100-μM roscovitine (B). The +70 mV step durations shown are 0.3, 0.8, 2.0, and 9.0 ms for both control and roscovitine. Exponential fits to the tail currents are superimposed on the tail currents. These fits were single-exponential equations for control, whereas double exponentials were used for tail currents in roscovitine. The currents were recorded 30 mM Ba2+. (C) The amplitudes of the exponential fits are plotted versus step duration. These amplitudes were fit to a single exponential (after a 0.3-ms delay) to obtain an estimate of the activation τ for each component. For control (open circles) the activation τ was 0.4 ms. The single-exponential fit to control data was scaled (*0.4, dashed line) to show that the fast deactivation component (control-like τD, solid circles) in roscovitine activated with the same time course as that in control. The amplitude of this component peaked at ∼1 ms and monotonically declined with longer step pulses. The amplitude of the slowly deactivating current in roscovitine (solid squares) increases monotonically with step duration after a brief delay (∼0.3 ms). These data and their single-exponential fit are replotted in D along with data from 10- and 30-μM roscovitine to illustrate the concentration-dependence of activation of the slowly deactivating tails. The time constants for each fit are indicated. (E) A plot of the roscovitine-induced inverse envelope τ versus roscovitine concentration is well fit by a linear regression (see text). The slope of this line is 0.0038 μM−1 ms−1 and the y-intercept is 0.23 ms−1, which yields KD = 60 μM. Data in AD are from the same cell, and data in E are the average of three cells.
SCHEME 1
SCHEME 1
[R] indicates roscovitine concentration.
SCHEMES 2 and 3
SCHEMES 2 and 3
The rate constant (A, s−1) and charge moved (z) for each transition are given in Table 1. The binding rate constants have units of μM−1 s−1.
SCHEMES 2 and 3
SCHEMES 2 and 3
The rate constant (A, s−1) and charge moved (z) for each transition are given in Table 1. The binding rate constants have units of μM−1 s−1.
FIGURE 7
FIGURE 7
A model of roscovitine binding to open N-channels can reproduce the whole-cell data. All solid lines are either experimental data or fits to that data (n = 3–7 cells). The data from Scheme 2 simulations are indicated by the open symbols and Scheme 3 simulation data are shown by solid symbols. (A) The activation-voltage relationships measured from simulated tail currents are nicely described by the major (80% of maximum current) and steeper (slope = 7.1 mV) component of double Boltzmann fits to whole-cell data (smooth lines). (B) Roscovitine slows activation of simulated currents at hyperpolarized voltages. τA was from single-exponential fits to currents starting 0.3 ms into the voltage step and is plotted versus step voltage. For comparison, τA from whole-cell data is also shown (control, thin line; roscovitine, thick line). (C) τD measured from simulated tail currents (10-ms step to +50 mV, followed by 14-ms step to the tail voltage) are plotted for control (squares) and 100-μM roscovitine (circles). The smooth lines are single-exponential fits to whole-cell τD-voltage relationship in both control and 100-μM roscovitine. These fits were obtained from τD averaged from seven cells. (D) The inverse envelope τ are plotted versus roscovitine concentration. The solid line is the regression fit to Scheme 3 simulated data (solid circles), whereas the dashed line (long dashes) is the fit to Scheme 2 simulated data (open circles). The indicated KD was calculated from the same fit parameters as in Fig. 6. The regression fit from Fig. 6 E is superimposed (short dashes) for comparison with the simulated data.
FIGURE 8
FIGURE 8
Roscovitine increases the duration of AP-induced N-current. (A) Whole-cell currents recorded before (thin trace) and during (thick trace) application of 100-μM roscovitine. The initial outward current is gating current that is activated during the rising phase of the AP. The gating current has not been studied, but is likely generated by gating charge movement in sodium, calcium, and potassium channels. The AP waveform used to generate these currents is described in Materials and Methods. (B) Simulated currents using Scheme 3. The control current is shown as a thin trace and current in 100-μM roscovitine is shown as a dashed trace. The thick trace is the roscovitine-modified current decreased by 30% to account for the inhibitory action of roscovitine on the whole-cell current.

References

    1. Yan, Z., P. Chi, J. A. Bibb, T. A. Ryan, and P. Greengard. 2002. Roscovitine: a novel regulator of P/Q-type calcium channels and transmitter release in central neurons. J. Physiol. (Lond). 540:761–770. - PMC - PubMed
    1. Knockaert, M., P. Greengard, and L. Meijer. 2002. Pharmacological inhibitors of cyclin-dependent kinases. Trends Pharmacol. Sci. 23:417–425. - PubMed
    1. Grantham, C. J., D. Bowman, C. P. Bath, D. C. Bell, and D. Bleakman. 1994. Omega-conotoxin MVIIC reversibly inhibits a human N-type calcium channel and calcium influx into chick synaptosomes. Neuropharmacology. 33:255–258. - PubMed
    1. Hillyard, D. R., V. D. Monje, I. M. Mintz, B. P. Bean, L. Nadasdi, J. Ramachandran, G. Miljanich, A. Azimi-Zoonooz, J. M. McIntosh, L. J. Cruz, J. S. Imperial, and B. M. Olivera. 1992. A new Conus peptide ligand for mammalian presynaptic Ca2+ channels. Neuron. 9:69–77. - PubMed
    1. Kuffler, S. W., and T. J. Sejnowski. 1983. Peptidergic and muscarinic excitation at amphibian sympathetic synapses. J. Physiol. 341:257–278. - PMC - PubMed

MeSH terms