. 2005 Sep;89(3):1482-92.
doi: 10.1529/biophysj.104.057885. Epub 2005 Jun 10.

Effects of organelle shape on fluorescence recovery after photobleaching

Affiliations

Effects of organelle shape on fluorescence recovery after photobleaching

Ivo F Sbalzarini et al. Biophys J. 2005 Sep.

Abstract

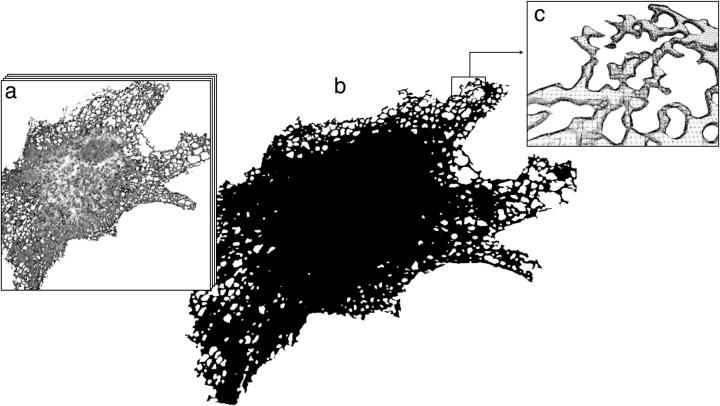
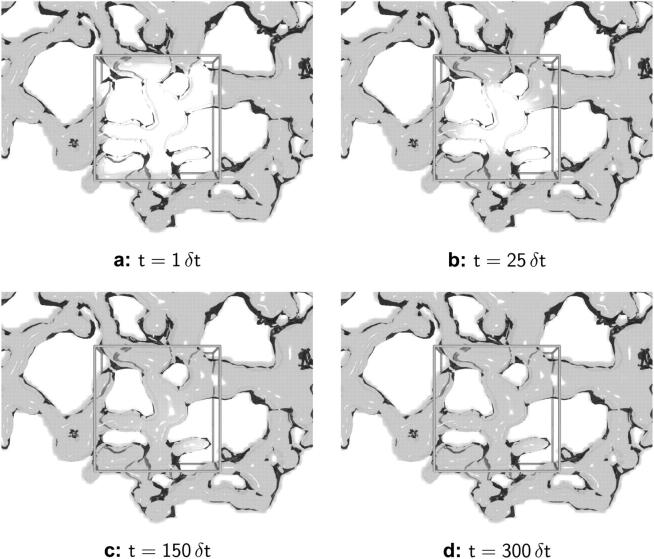
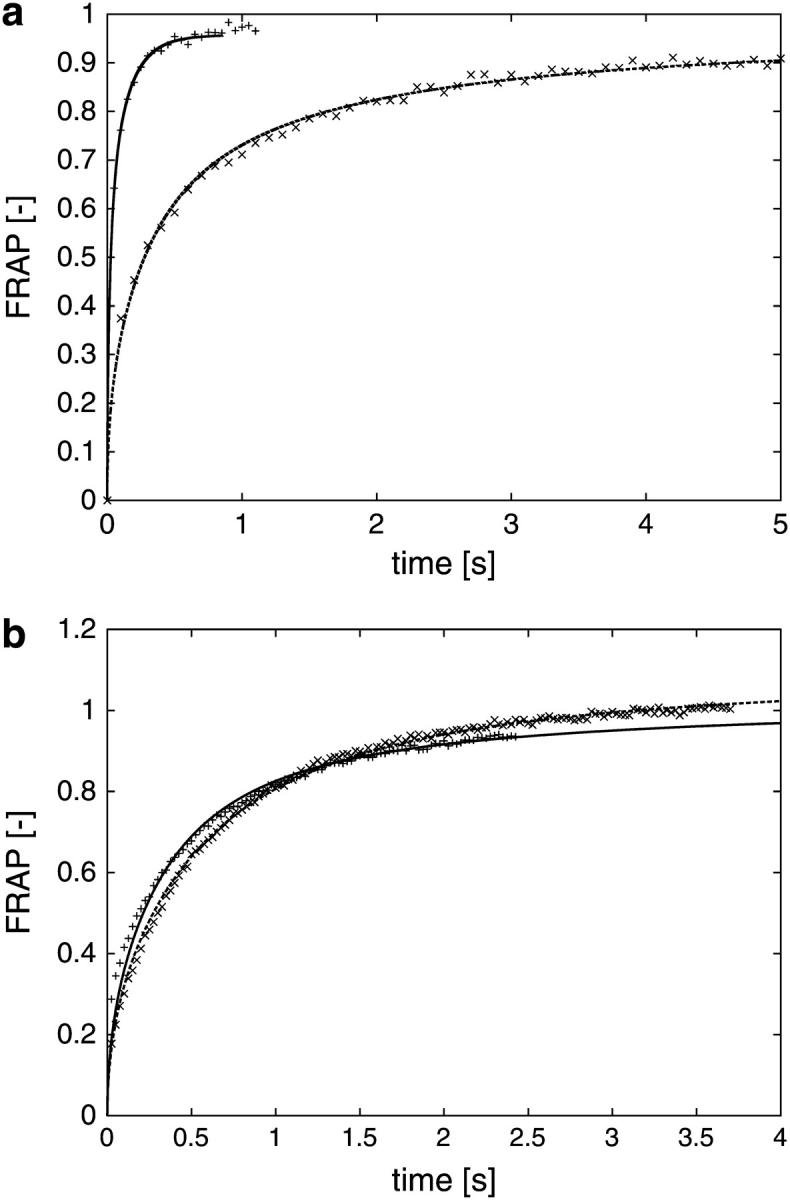
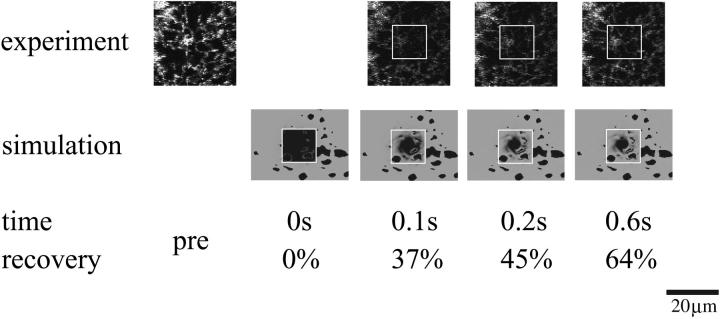
The determination of diffusion coefficients from fluorescence recovery data is often complicated by geometric constraints imposed by the complex shapes of intracellular compartments. To address this issue, diffusion of proteins in the lumen of the endoplasmic reticulum (ER) is studied using cell biological and computational methods. Fluorescence recovery after photobleaching (FRAP) experiments are performed in tissue culture cells expressing GFP-KDEL, a soluble, fluorescent protein, in the ER lumen. The three-dimensional (3D) shape of the ER is determined by confocal microscopy and computationally reconstructed. Within these ER geometries diffusion of solutes is simulated using the method of particle strength exchange. The simulations are compared to experimental FRAP curves of GFP-KDEL in the same ER region. Comparisons of simulations in the 3D ER shapes to simulations in open 3D space show that the constraints imposed by the spatial confinement result in two- to fourfold underestimation of the molecular diffusion constant in the ER if the geometry is not taken into account. Using the same molecular diffusion constant in different simulations, the observed speed of fluorescence recovery varies by a factor of 2.5, depending on the particular ER geometry and the location of the bleached area. Organelle shape considerably influences diffusive transport and must be taken into account when relating experimental photobleaching data to molecular diffusion coefficients. This novel methodology combines experimental FRAP curves with high accuracy computer simulations of diffusion in the same ER geometry to determine the molecular diffusion constant of the solute in the particular ER lumen.


Figures

FIGURE 1
FIGURE 1
Three-dimensional reconstruction of an ER sample from a VERO cell. (a) The reconstruction is done starting from a stack of 50 serial sections with Δz = 0.1 μm from confocal microscopy of a VERO cell expressing ssGFP–KDEL. (b) Computer visualization of the triangulated 3D reconstruction consisting of 739,956 triangles. (c) Detail view of the top right section of the reconstruction with individual triangles shown. Hidden lines are removed for better clarity. Note that due to microscope resolution limitations, only the peripheral areas are trustworthy. FRAP simulations are thus only made close to the cell periphery.
FIGURE 2
FIGURE 2
Snapshots of concentration distribution from a sample PSE simulation in a reconstructed ER geometry. The results at times t = 1 δt (a), t = 25 δt (b), t = 150 δt (c), and t = 300 δt (d) are shown for a molecular diffusion constant of D = 3 × 10⁻⁵ b2/δt. All units are scaled with the simulation time step δt and the lateral edge length b of the bleached region. The ER membrane is visualized as a transparent surface and the concentration of green fluorescent protein as a volume density cloud inside it. The bleached region is represented by the outline of a cube. Only the part of the ER around the bleached region is shown.
FIGURE 3
FIGURE 3
(a) Simulated FRAP curves compared to experimental measurement data for different ER. The computer simulations are done using the method of particle strength exchange as outlined in the Materials and Methods section. The experiment is a standard FRAP experiment, preceded by the recording of a stack of serial sections used for the reconstruction of the geometry. The simulated FRAP curves (lines) are stretched in time to fit the experimental data (symbols). As time and diffusion constant are inversely proportional, this allows us to estimate the molecular diffusion constant while fully taking the specific geometry into account (cf. main text). For the two examples shown, the molecular diffusion constants are determined to be 34.4 μm2/s (faster curve, +), and 34.2 μm2/s (slower curve, ×), respectively. All curves are normalized by their asymptotic value to allow comparison. (b) Simulated FRAP curves compared to experimental measurement data for different locations of the bleached region. Two FRAP experiments, followed by corresponding PSE simulations, performed for two different, but overlapping, bleached regions in the same ER. The result after fitting the simulation results (lines) to the measurement (symbols) is shown. The two bleached regions are given in microscope coordinates as: × (191,190)–(229,228) and + (218,196)–(256,234), corresponding to 4 × 4 μm, and the molecular diffusion constants are 1.8 μm2/s (×) and 1.6 μm2/s (+), respectively. All curves are normalized by their asymptotic value to allow comparison.
FIGURE 4
FIGURE 4
Visual comparison between FRAP experiment and computer simulation. Micrographs from a standard FRAP experiment (cf. Materials and Methods) are compared to visualizations from the corresponding computer simulation. The case corresponds to the slower curve in Fig. 3 a and the reconstructed geometry shown in Fig. 1. Experimental images were acquired every 100 ms with a spatial resolution of 0.18 μm/pixel. The simulation entailed 6.8 million particles and comprised the whole ER (cf. Materials and Methods). The figure only depicts the portion of the ER in the vicinity of the region of interest. The molecular diffusion coefficient is determined from the fit shown in Fig. 3 a to be 34.2 μm2/s. The bleached region is indicated by its outline. No experimental image was acquired during bleaching. Note that the experimental images show a confocal section through the middle of the cell, whereas the visualizations from the simulation show the top view onto a closed three-dimensional geometry. The recovery percentages of the simulation match those of the experiment to within ±1%.
FIGURE 5
FIGURE 5
(a) Comparison of simulated FRAP curves for four different ER samples. All simulations are done using the same computational diffusion constant and the same simulation parameter settings (see Supplementary Material for details). All curves are normalized by their asymptotic value to allow comparison (cf. Supplementary Material). The variation observed in the FRAP curves is therefore only caused by the different geometries of the ER samples. The recovery half-times vary within the interval [5.7…14.2] × 100δt. (b) Comparison of simulated FRAP curves for different bleached areas in the same ER sample. The bleached regions are given by the microscope coordinates of their bottom left and top right corners as follows: □ (225,125)–(300,200); * (350,200)–(400,250); + (250,125)–(300,175); × (80,300)–(130,350). Simulation parameters and computational D are kept constant (cf. Supplementary Material). All curves are normalized by their asymptotic value to allow comparison.

References

    1. Lippincott-Schwartz, J., E. Snapp, and A. Kenworthy. 2001. Studying protein dynamics in living cells. Nat. Rev. Mol. Cell Biol. 2:444–456. - PubMed
    1. Swaminathan, R., C. P. Hoang, and A. S. Verkman. 1997. Photochemical properties of green fluorescent protein GFP–S65T in solution and transfected CHO cells: analysis of cytoplasmic viscosity by GFP translational and rotational diffusion. Biophys. J. 72:1900–1907. - PMC - PubMed
    1. Phair, R. D., and T. Misteli. 2000. High mobility of proteins in the mammalian cell nucleus. Nature. 404:604–609. - PubMed
    1. Dayel, M. J., E. F. Hom, and A. S. Verkman. 1999. Diffusion of green fluorescent protein in the aqueous-phase lumen of the endoplasmic reticulum. Biophys. J. 76:2843–2851. - PMC - PubMed
    1. Nehls, S., E. L. Snapp, N. B. Cole, K. J. M. Zaal, A. K. Kenworthy, T. H. Roberts, J. Ellenberg, J. F. Presley, E. Siggia, and J. Lippincott-Schwartz. 2000. Dynamics and retention of misfolded proteins in native ER membranes. Nat. Cell Biol. 2:288–295. - PubMed

Publication types

MeSH terms

LinkOut - more resources