. 2005 Jul;7(7):653-64.
doi: 10.1038/ncb1269. Epub 2005 Jun 12.

Endosome-to-cytosol transport of viral nucleocapsids

Affiliations

Endosome-to-cytosol transport of viral nucleocapsids

Isabelle Le Blanc et al. Nat Cell Biol. 2005 Jul.

Abstract

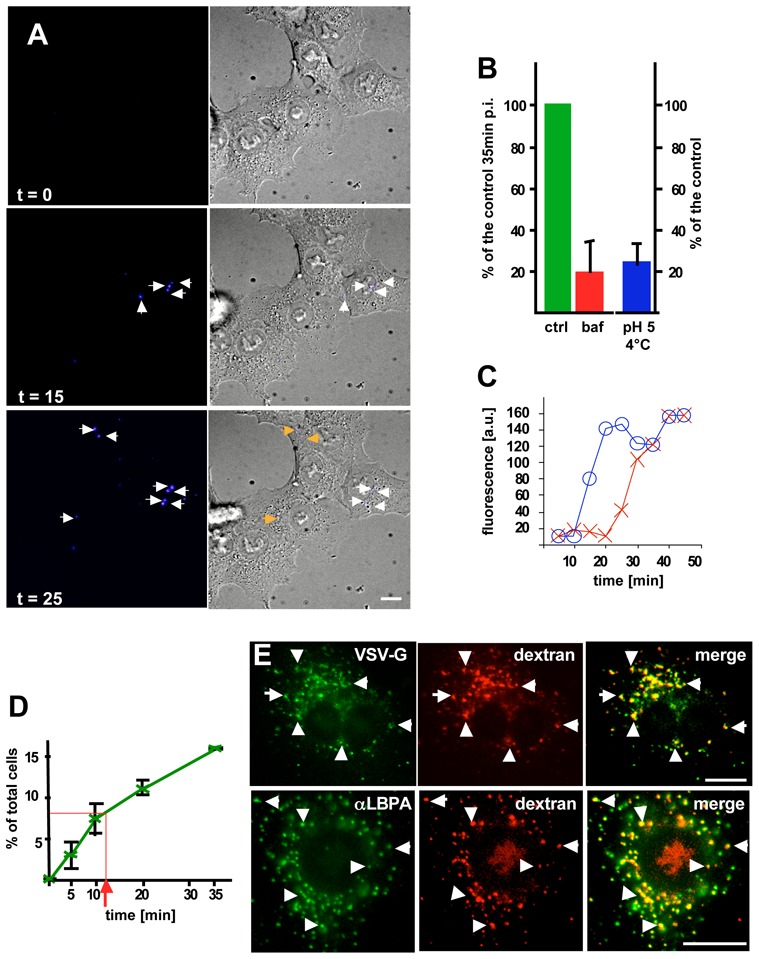
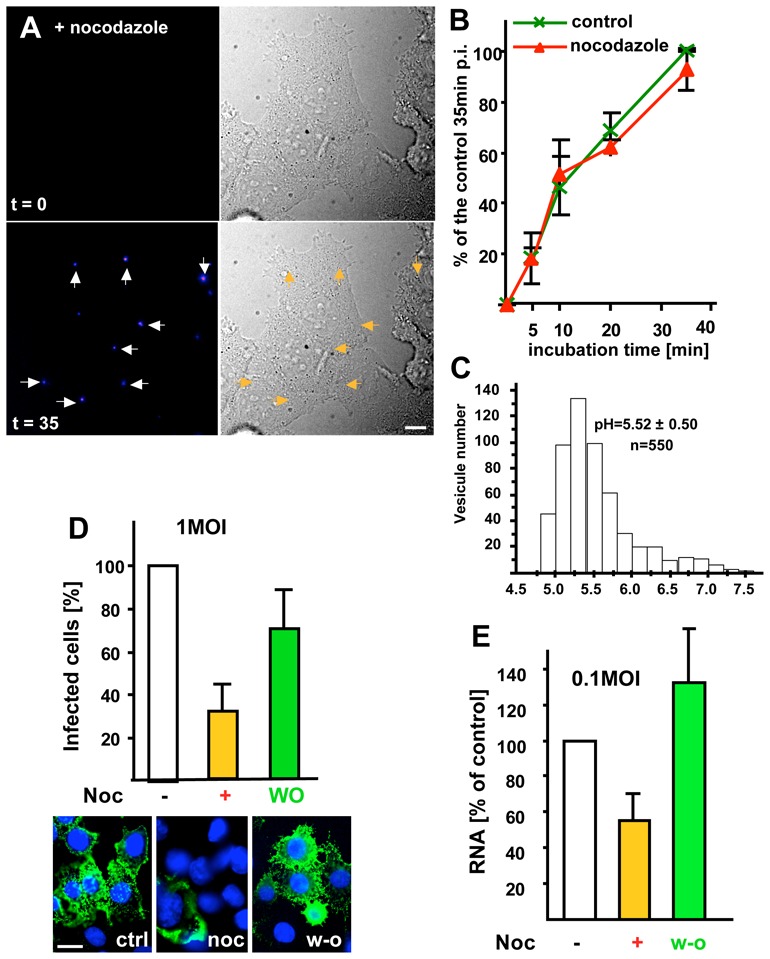
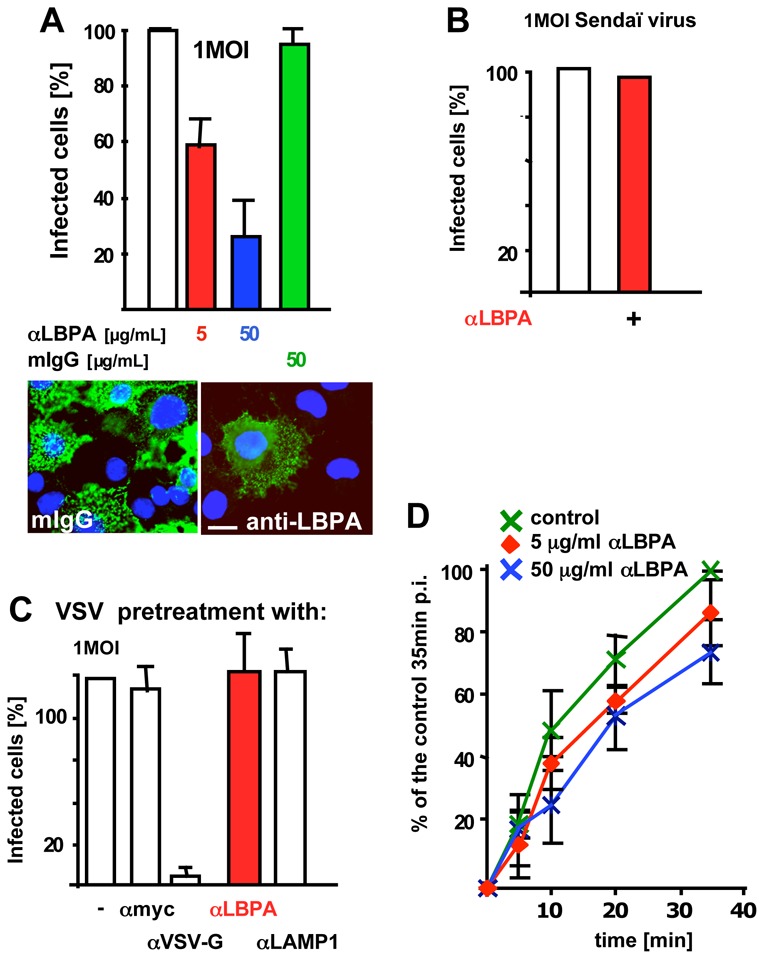
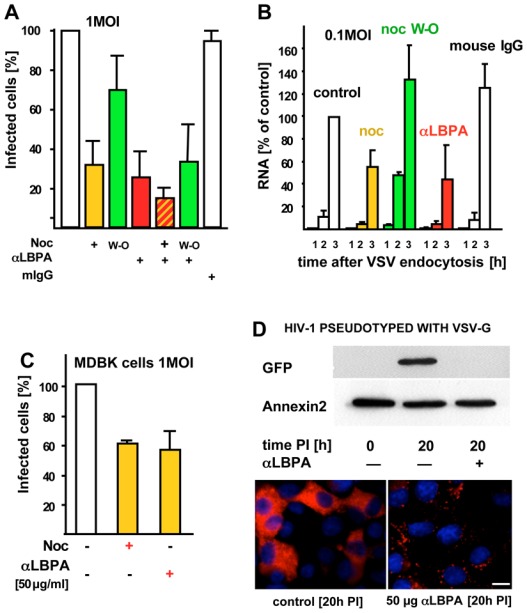
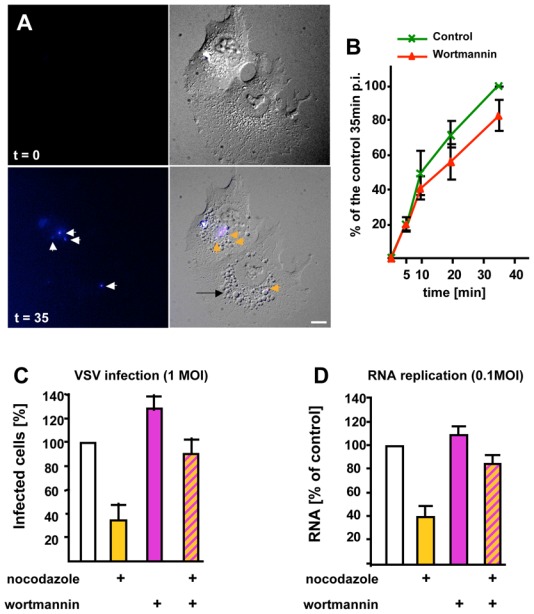
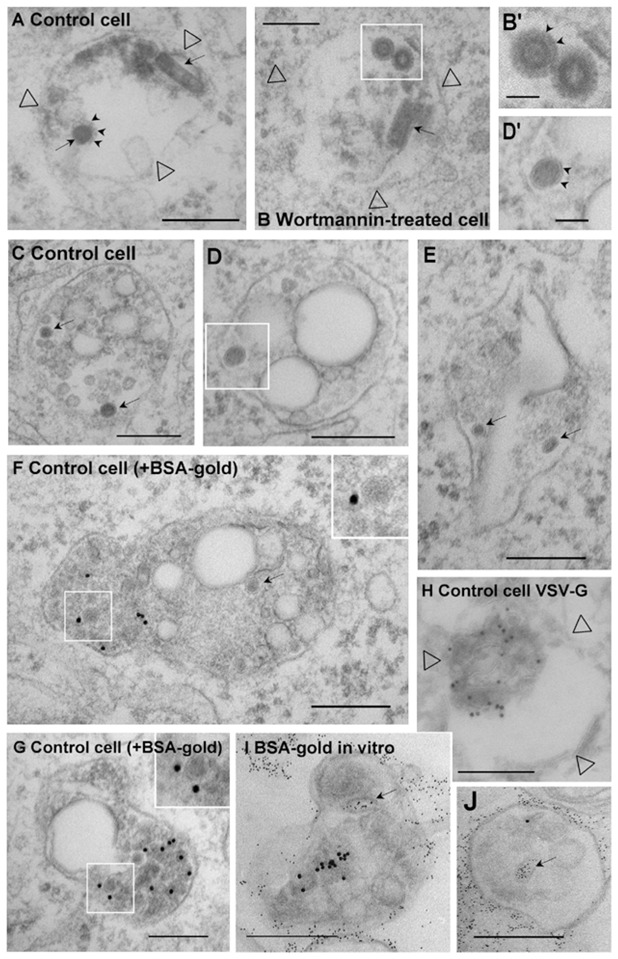
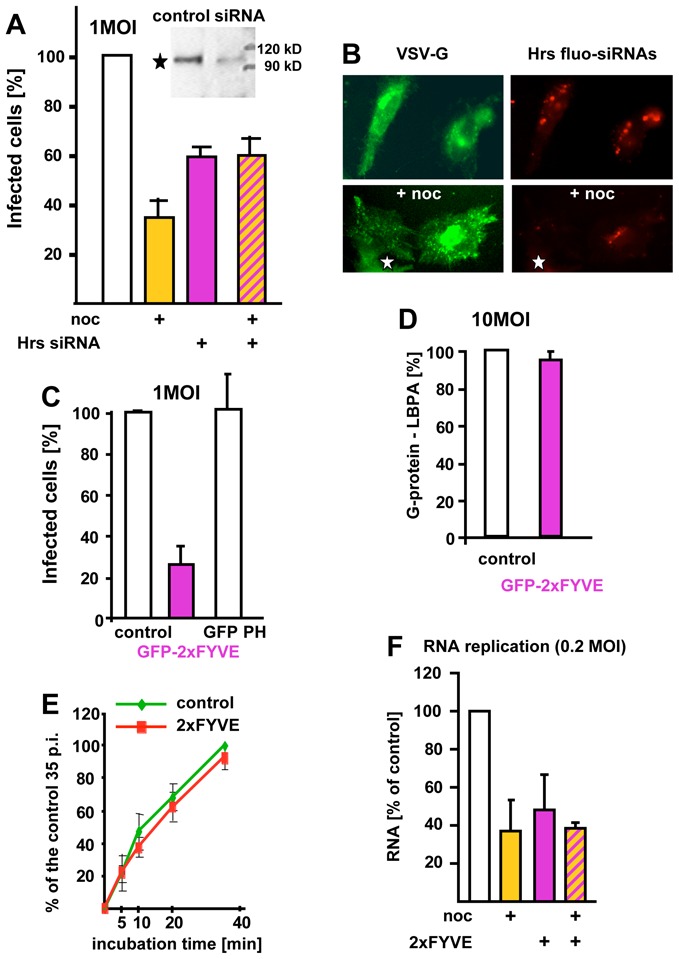
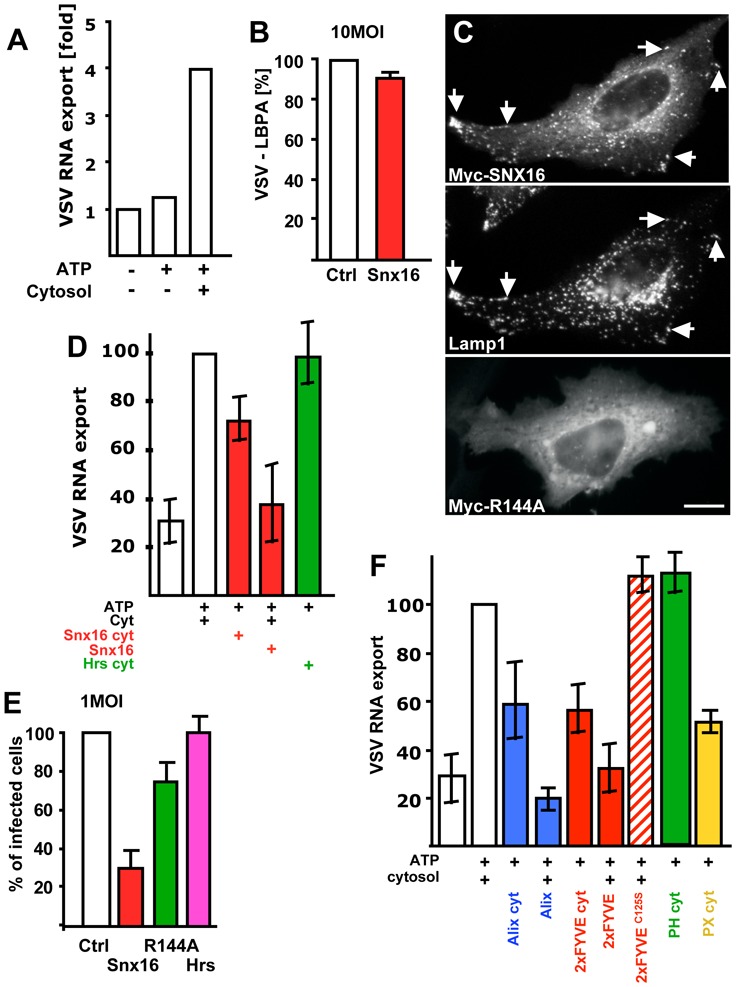
During viral infection, fusion of the viral envelope with endosomal membranes and nucleocapsid release were thought to be concomitant events. We show here that for the vesicular stomatitis virus they occur sequentially, at two successive steps of the endocytic pathway. Fusion already occurs in transport intermediates between early and late endosomes, presumably releasing the nucleocapsid within the lumen of intra-endosomal vesicles, where it remains hidden. Transport to late endosomes is then required for the nucleocapsid to be delivered to the cytoplasm. This last step, which initiates infection, depends on the late endosomal lipid lysobisphosphatidic acid (LBPA) and its putative effector Alix/AIP1, and is regulated by phosphatidylinositol-3-phosphate (PtdIns3P) signalling via the PtdIns3P-binding protein Snx16. We conclude that the nucleocapsid is exported into the cytoplasm after the back-fusion of internal vesicles with the limiting membrane of late endosomes, and that this process is controlled by the phospholipids LBPA and PtdIns3P and their effectors.


Figures

Figure 1
Figure 1. VSV fusion
(A) BHK cells were incubated with low amounts (0.3 MOI) Dil-labeled VSV at 4°C. The temperature was raised to 37°C, and cells were imaged by time-lapse confocal microscopy. The figure shows frames captured at the indicated time, and arrows point at fluorescent spots that represent fusion events. (B) Cells were treated as in (A) in the presence (baf) or absence (ctrl) of 1μM bafilomycinA1. The number of cells containing fused viruses was counted after 35 min at 37°C (post-infection: p-i ). Alternatively, cells with bound virions were incubated at pH 5.0 at 4°C, and fusion events were immediately counted and expressed as a percentage of the control at 37°C. (C) The figure shows two representative examples of the endocytic time-course of viral fusion (as in A): the emitted fluorescence was quantified after tracking each spot in the sequence. (D) The number of cells treated as in (A) containing fused viruses was counted at the indicated times during the 37°C incubation, and is expressed as a percentage of the total cell number. (E) Excess virus (50μg/1.3x107 cells) were pre-bound to the cell surface (as in A), and then co-endocytosed with rhodamine-dextran for 5 min at 37°C, followed by a 40 min chase without dextran. Cells were processed for immnofluorescence and labeled with the indicated antibodies. VSV-G colocalized with endocytosed dextran (upper panels), which itself colocalized with LBPA (lower panels). Number of experiments: B, 3; D, 4. Bars, A: 2,5μm; E: 4μm.
Figure 2
Figure 2. Microtubule-dependent transport
(A) Viral fusion was studied as in Fig 1A in cells pre-treated with 10μM nocodazole for 2h (the drug was present throughout the experiment), and frames were captured at the indicated time. (B) After treatment with or without nocodazole as in (A), the number of cells containing fused viruses was counted at the indicated times during the 37°C incubation. Values are expressed as a percentage of the untreated control after 35min, as in Fig 1B. (C) After microtubule depolymerization as in (A), BCECF-dextran was endocytosed for 10 min at 37°C and chased for 35min. The pH of individual endosomes was measured by BCECF-dextran fluorescence ratio imaging. The histogram shows the pH distribution of 550 endosomes with the means ± SD indicated on the figure. (D) VSV (1MOI) was bound at 4°C to the surface of BHK cells preincubated without (control, ctrl) or with nocodazole (noc), as in (A). Cells were incubated for 3h at 37°C to allow infection to proceed. When indicated (W-O, wash out), nocodazole was removed, and incubation continued without drugs for 2h. Cells were analyzed by immunofluorescence microscopy using antibodies against VSV-G after labeling nuclei with DAPI (blue). Typically, ≈70% of the cells were infected under control conditions, and the number of infected cells is expressed as a percentage of the untreated control. (E) Cells treated or not with nocodazole (as in D) were infected with 0.1 MOI VSV. Replication of VSV RNA minus strand was quantified by TaqMan-RT-PCR and results are expressed as a percentage of the untreated control. Number of experiments: B, 3; D, 6; E, 4. Bars, A: 2,5μm; D: 4μm.
Figure 3
Figure 3. VSV infection requires transport to late endosome
(A) Cells were preincubated with 5 or 50μg/ml anti-LBPA (αLBPA) antibody or 50μg/ml mouse IgG (mIgG) for 14h. Cells were then infected with 1MOI VSV for 3h, fixed, analyzed by fluorescence microscopy (example shown with 50μg/ml antibody). Infected cells were quantified as in Fig 2D. (B) Cells treated as in A with 50μg/ml anti-LBPA antibodies were infected with recombinant Sendaï virus expressing RedFP (1MOI) for 14h, and analyzed by fluorescence microscopy. Infected cells are expressed as a percentage of the untreated controls — typically, 25% of the cells were infected in controls. (C) VSV was preincubated for 1h at 4°C with antibodies against the indicated antigens, bound to the cell surface for 1h at 4°C and used for cell infection as in (A). Infected cells were quantified as in Fig 2D. (D) Cells were pre-treated with anti-LBPA antibodies, as in A. Then, viral fusion was studied as in Fig 1A, and quantified as in Fig 2B. Number of experiments: A, 4; B, 3; C, 3; D: 4. Bar, A: 4μm
Figure 4
Figure 4. Combination of treatments and RNA replication
(A) Cells pre-treated with 50μg/ml anti-LBPA antibody or mouse IgG, as in Fig 3A, were then incubated with nocodazole as in Fig 2D with or without wash-out (W-O), and infected with 1MOI VSV. Then cells were analyzed by fluorescence microscopy, and infected cells were quantified as in Fig 2D. (B) Cells treated essentially as in (A) were infected with 0.1 MOI VSV. Replication of VSV RNA minus strand was quantified by RT-PCR, as in Fig 2E, at the indicated times after VSV endocytosis. Results are expressed as a percentage of RNA replication measured in the 3h control. It should be noted that all experiments in (A) or (B), but also in Fig 2D and E, and Fig 5C were performed in parallel on the same day. Data were split into separate figures for the sake of clarity. (C) Madin-Darby bovine kidney (MDBK) cells were infected with VSV without or with nocodazole or anti-LBPA antibodies, as in Fig 2A and 3A, respectively. Effects of anti-LBPA antibodies were less pronounced than in BHK or HeLa cells, presumably because MDBK cells did not take up antibodies as efficiently. (D) BHK cells, treated (αLBPA) or not with anti-LBPA antibodies as in Fig 3A, were infected with HIV-1 pseudotyped with VSV-G and expressing GFP. After 20h (20h PI), GFP expression was analyzed by SDS gel electrophoresis and Western blotting using anti-GFP antibodies, or anti-annexin2 antibodies as a loading marker (upper panel). Alternatively cells were analyzed by immunofluorescence using a monoclonal anti-GFP antibody, followed by rhodamine-labeled anti-mouse antibodies. Treated cells show a punctate staining pattern, corresponding to the endocytosed anti-LBPA (revealed by the secondary anti-mouse antibody), but not the diffuse GFP staining pattern visible in the controls. Number of experiments: A–B, 4; C, 3. Bar, D: 4μm
Figure 5
Figure 5. PI 3-kinase inhibition
(A) Cells were treated with Dil-labeled VSV and analyzed as in Fig 1A, except that 100nM wortmannin was added. The figure shows frames captured at the indicated time. The black arrow points vacuoles appearing after wortmannin treatment. (B) Cells were treated as in (A) with or without wortmannin. The number of cells containing fused viruses was counted at the indicated times during the 37°C incubation, and is expressed as in Fig 2B. (C–D) VSV at the indicated MOI was endocytosed with or without nocodazole, as in Fig 2D, except that cells were treated with 100nM wortmannin 5 min after raising the temperature to 37°C. [Wortmannin was omitted during the initial 5 min, because the drug inhibits internalization.] In (C), cells were analyzed by fluorescence microscopy, and infected and non-infected cells were quantified as in Fig 2D, while in (D) replication of viral RNA was measured as in Fig 2E. Number of experiments: B–D, 4. Bar, A: 2,5μm.
Figure 6
Figure 6
(A–H) After pre-binding to the surface (Fig 2D), VSV (100μg per 106 cells) was co-endocytosed with (F–G) or without (A-E and H) 10nm BSA-gold (OD = 1.7) for 10 min at 37°C, and then for 40 min without BSA-gold, in BHK cells treated (B) or not (A and C–H) with wortmannin. Cells were then processed for electron microscopy. (A–B) These panels show endosome (empty arrowheads point at the membrane) largely devoid of internal vesicles, presumably early endosomes, which contain both bullet-shaped virions and virions viewed in cross-section (arrows; small arrows point at G-protein spikes). (C–G) Electron-dense structures without a visible spike-delineated envelope, presumably capsids (arrows) are found within internal vesicles (see insets and the boxed area in D shown in D′; note clear membrane indicated by arrowheads in D′) of late endosomes containing gold particles in their lumen (F–G). (H) Experiment as in (A) and then the G-protein distribution was analyzed by immunogold labeling of cryo-sections using anti-VSV-G antibodies (empty arrowheads point at the membrane): note the characteristic electron-lucent space that is also observed in plastic embedded samples (C–G). (I–J) The G-protein was endocytosed for 45 min at 37°C into BHK cells after labeling at the cell surface with a polyclonal antibody against G and then with 10nm proteinA-gold. Endosomal fractions were then prepared and incubated in vitro (as in Fig 8A) at 4°C with 4nm BSA-gold, and processed for electron microscopy. Note that BSA-gold labels apparently internal structures (arrows), which must have continuity with the limiting membrane (and are equivalent to cytoplasmic space) out of the plane of section. Bars: A–J: 0.2μm; B′-D′: 0.05μm).
Figure 7
Figure 7. Hrs and PI3P
(A–B) The expression of Hrs was silenced using fluorescently labeled siRNAs (Hrs fluo-siRNAs), to identify transfected cells (B). The inset in (A) shows the Western blot of cells treated with Hrs siRNAs using anti-Hrs antibodies. Cells were then infected with VSV with or without nocodazole (noc), as in Fig 2D, and analyzed by fluorescence microscopy to identify cells containing labeled siRNAs and cells expressing VSV-G. The star shows an infected cell that did not contain siRNAs, for comparison. Infected and non-infected cells were quantified as in Fig 2D. (C) Cells were transfected with GFP-2xFYVE or GFP-PH for 36h, infected with VSV (1MOI), and analyzed by fluorescence microscopy to identify transfected cells. Infected and non-infected cells were quantified as in Fig 2D. (D) After transfection with GFP-2xFYVE, as in (C), excess VSV (50μg/1.3 × 107 cells) was bound to the cell surface. The virus was labeled with anti-VSV antibodies, followed by secondary antibodies and then endocytosed for 45 min, as in Fig 1E. Cells were fixed, labeled with anti-LBPA antibodies and analyzed by double-channel fluorescence. The number of cells where both markers colocalized was counted and is expressed as a percentage of the control. (E) Viral fusion was quantified as in Fig 1A–B in cells overexpressing GFP-2xFYVE, as in C. (F) RNA replication was quantified as in Fig 2E in HeLa cells overexpressing GFP-2xFYVE with or without nocodazole (noc) treatment. Number of experiments: A, C–F, 3. Bar, B: 4μm
Figure 8
Figure 8. Nucleocapsid release in vitro
(A) Late endosomes were loaded with VSV in vivo, and endosomal fractions were prepared. These fractions [18μg] were incubated in vitro with an ATP-regenerating (ATP), with or without cytosol for 20 min at 37°C. Then, free (cytosolic) RNA was separated from endosome-associated RNA by floatation in a sucrose gradient, and VSV RNA minus strand was quantified by TaqMan-RT-PCR. RNA export is expressed as the ratio of free RNA released in the presence of ATP and cytosol over the negative controls without cytosol and ATP. (B) VSV endocytosed for 45 min (as in Fig 1E) in cells expressing Snx16-myc was analyzed by fluorescence microscopy; VSV-G colocalization with LBPA was quantified as in Fig 7D. (C) After expression of WT Snx16-myc or Snx16R144A-myc, HeLa cells were processed for immunofluorescence using antibodies against myc and Lamp1 (upper panels, double immuno-fluorescence) or myc alone (lower panel). (D) The assay was as (A) with cytosol prepared from cells overexpressing Snx16 (Snx16 cyt) or Hrs (Hrs cyt), or with control cytosol supplemented with 0.5μg purified recombinant Snx16 (Snx16). (E) Cells expressing or not Snx16, Snx16R144A or Hrs were infected with VSV (1MOI), and analyzed by fluorescence microscopy; infected and non-infected cells were quantified as in Fig 2D. (F) The assay was as in (A) with cytosol prepared from cells overexpressing GFP-2xFYVE (2xFYVE cyt), Alix (Alix cyt), the GFP-PH domain of PLC™ (PH cyt) or the GFP-PX domain of p40phox (PX cyt). Alternatively, the assay was carried out with control cytosol supplemented with 0.5μg purified, recombinant Alix, GST-2xFYVE (2xFYVE) or GST-2xFYVEC125S (2xFYVEC125S). VSV RNA export was expressed as a percentage of the positive control, to facilitate comparison between different experiments. Number of experiments: A, 6; B–E 3; F, 4. Bar, C: 2,5μm.

Comment in

References

    1. Conner SD, Schmid SL. Regulated portals of entry into the cell. Nature. 2003;422:37–44. - PubMed
    1. Mukherjee S, Maxfield FR. Role of Membrane Organization and Membrane Domains in Endocytic Lipid Trafficking. Traffic. 2000;1:203–211. - PubMed
    1. Sannerud R, Saraste J, Goud B. Retrograde traffic in the biosynthetic-secretory route: pathways and machinery. Curr Opin Cell Biol. 2003;15:438–45. - PubMed
    1. Gruenberg J. The endocytic pathway: a mosaic of domains. Nature Reviews Molecular Cell Biology. 2001;2:721–30. - PubMed
    1. Katzmann DJ, Odorizzi G, Emr SD. Receptor downregulation and multivesicular-body sorting. Nat Rev Mol Cell Biol. 2002;3:893–905. - PubMed

Publication types

MeSH terms

Substances