. 2005 Jun;6(2):136-47.
doi: 10.1007/s10162-004-5050-1. Epub 2005 Jun 10.

Influence of supporting cells on neuronal degeneration after hair cell loss

Affiliations

Influence of supporting cells on neuronal degeneration after hair cell loss

Mitsuru Sugawara et al. J Assoc Res Otolaryngol. 2005 Jun.

Abstract

In sensorineural hearing loss, hair cell loss is often followed by loss of cochlear nerve fibers, which can continue for years after the insult. The degree and time course of neuronal loss varies, but the reasons for this variation are unclear. The present study addresses this issue with a quantitative analysis of hair cell, supporting cell, and neuronal survival in animals with long-term survival of up to 5.5 years from two types of drug-induced hair cell loss: aminoglycoside antibiotics and platinum-containing chemotherapeutics. To complement the analysis of the effects of organ of Corti damage on neuronal survival, cases of primary neuronal degeneration, via auditory nerve section, are also assessed. Analysis shows that (1) long-term neuronal survival is enhanced when supporting cells in the inner hair cell (IHC) area remain intact; (2) after hair cell loss, the time course of neuronal loss is slower in the apex than in the base; (3) primary loss of cochlear nerve fibers does not lead to secondary degeneration of sensory cells or supporting cells in the organ of Corti; and (4) after auditory nerve section, there can be a massive reinnervation of the IHC region, especially in the apex. Results are consistent with the idea that supporting cells participate in the regulation of neuronal survival and neuronal sprouting in the organ of Corti.


Figures

Fig. 1
Fig. 1
Density of myelinated axons in the osseous spiral lamina in four normal chinchillas. A Schematic two-dimensional projection of the cochlea showing the relative positions of the six sections selected from each ear in which peripheral axons were counted; that is, the sections through each half turn in which the cochlear spiral is cut tangentially. B The plane of section and its position relative to the organ Corti. C Nerve fiber densities for each of four normal cases (black symbols) at each of the six sample locations are plotted along with the average value at each locus (gray symbols). Numbers below each gray symbol refer to the locations schematized in A.
Fig. 2
Fig. 2
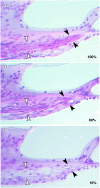
Photomicrographs of sections through the osseous spiral lamina from the apical turn of three different cats, selected to illustrate the visual rating scale used to assess fiber density. In each panel, fiber density estimate assigned by the observer is indicated in the lower right corner. The pairs of arrowheads span the region of the spiral lamina which was included in the visual analysis. A Normal cat, B 1.5-year survival from kanamycin treatment, C 3.1-year survival from kanamycin treatment.
Fig. 3
Fig. 3
Long-survival carboplatin-treated chinchillas show selective loss of inner hair cells (D, E) compared to normal ears (A, B) as well as loss of the peripheral axons of auditory nerve fibers from the osseous spiral lamina (C, F). B, E Higher magnifications of the dotted regions in A and D, respectively. White-filled arrows point to nuclei of inner phalangeal cells, black arrows point to nuclei of inner border cells, gray-filled arrows point to the bodies of inner pillar cells. C, F From tangential sections through the osseous spiral lamina as schematized by the simulated section planes in A and D: black arrows point to individual myelinated fibers cut in cross-section. All images are from the upper basal turn.
Fig. 4
Fig. 4
Patterns of hair cell, supporting cell, and neuronal degeneration in four carboplatin-treated chinchillas: two with relatively short survival (A, B) and two with relatively long survival (C, D). Symbol key in D applies to all panels. Hair cell and supporting cell data are averaged over bins corresponding to 5% of cochlear length. Neuronal counts are made in the six regions indicated in Figure 1A and are expressed relative to the average data from normal ears shown in Figure 1C.
Fig. 5
Fig. 5
Correlation between inner hair cell survival and neuronal survival for all carboplatin-treated ears, shown separately for short-survival (A, n = 10 cochleas) and long-survival cases (B, n = 5 cochleas). Data on these graphs compare the estimated fractional neuronal survival for one cochlear region of one ear to the value of IHC loss for the same cochlear region of the same ear (both values computed as described in Fig. 3). Data from the cochlear base, middle, and apex are plotted with different symbols (see key) and correspond to regions in Figure 1A labeled 1; 2, 3, and 4; or 5 and 6, respectively. Dashed line in B represents the best fit straight line; the equation describes the slope and intercept of that line.
Fig. 6
Fig. 6
Photomicrographs illustrating the selective loss of hair cells in kanamycin-treated ears (C, D, E, F, G) and the improved neuronal survival compared to regions in which supporting cells of the organ of Corti are lost as well (H). Black arrows in A, C, E, G, and H point to the ganglion cell region. A, C, and E Comparison of neuronal survival in the apical turn of control ear with two long-surviving kanamycin ears. Gray ellipses surround peripheral axons in the osseous spiral lamina. B, D, and F. High-power views of the IHC areas shown in dotted squares of A, C, and E, respectively. Black and white arrows indicate nuclei of IHC-supporting cells; gray arrows point to inner pillar cells, and white arrowhead (B only) indicates the stereocilia bundle on an IHC. G, H Low-power micrographs of the cochlear duct in two adjacent half turns from the same kanamycin ear: locations of these views are indicated on the cytocochleogram in Figure 6.
Fig. 7
Fig. 7
Patterns of hair cell, supporting cell, and neuronal degeneration in two kanamycin-treated cat cochleas: one with a 1.5-year posttreatment survival (A) and one with a 5.5-year posttreatment survival (B). Symbol key in B applies also to A. Hair cell and supporting cell counts and neuronal survival estimates are averaged over bins corresponding to 5% of cochlear length. Arrows in A labeled 5G and 5H refer to the micrographs taken from these two adjacent cochlear regions which appear in Figure 5. Cochlear length is converted to frequency according to a map derived by intracellular neuronal labeling (Liberman 1982a,b).
Fig. 8
Fig. 8
Correlation between survival of supporting cells in the IHC area and the survival of auditory nerve peripheral axons, considering only regions from kanamycin-treated ears in which all IHCs are destroyed. Data are plotted separately for cochleas with posttreatment survival of 1.5 to 4.2 years (A) vs. 5.5 years (B). Data for each of the four survival times represent observations from two cochleas from one animal. Points in both panels are derived from data such as those shown in Figure 6, except that estimates of fractional survival for both cell types are averaged over bins corresponding to contiguous 10% segments of cochlear length. Data from basal, middle, and apical turns of the cochlea are plotted with different symbols (see key). Data from the basalmost 10% are excluded from both plots.
Fig. 9
Fig. 9
Photomicrographs illustrating the cochlear duct (B) and IHC (D) area of a cat with 1.1-year survival from a surgical section of the auditory nerve. A, B Low-power micrographs of silver-stained sections through the cochlear duct: black arrow in B shows a fiber that traverses the spiral ganglion region without a cell body. White arrows point to two remaining spiral ganglion cells. C, D High-power views of the IHC area in the same sections shown in A and B. Dotted circle in C indicates cluster of radial afferent terminals under the normal IHC; arrow in C points to one terminal contacting the side of the IHC. Arrows in D point to spiraling fibers which appear to be reinnervating the denervated IHC.
Fig. 10
Fig. 10
Pattern of hair cell, supporting cell, and neuronal degeneration in one cat cochlea with a 1.1-year posttreatment survival from surgical section of the auditory nerve. All other conventions for data display are as described for Figure 6.

References

    1. Anniko M, Thornell LE, Gustavsson H, Virtanen I. Intermediate filaments in the newborn inner ear of the mouse. ORL J. Oto-Rhino-Laryngol. Relat. Spec. 1986;48:98–106. - PubMed
    1. Backus RM, DeGroot JC, Tange RA, Huizing EH. Pathological findings in the human auditory system following long-standing gentamicin ototoxicity. Arch. Oto. Rhino. Laryngol. 1987;244:69–73. - PubMed
    1. Bohne BA, Harding GW. Degeneration in the cochlea after noise damage: primary vs. secondary events. Am. J. Otol. 2000;21:505–509. - PubMed
    1. Brown MC, Berglund AM, Kiang NYS, Ryugo DK. Central trajectories of type II spiral ganglion neurons. J. Comp. Neurol. 1988;278:581–590. - PubMed
    1. Chen S, Rio C, Ji RR, Dikkes P, Coggeshall RE, Woolf CJ, Corfas G. Disruption of erbB receptor signaling in adult non-myelinating Schwann cells causes progressive sensory loss. Nat. Neurosci. 2003;6:1186–1193. - PubMed

Publication types

LinkOut - more resources