

Repetition-induced changes in BOLD response reflect accumulation of neural activity
- PMID: 15954142
- PMCID: PMC6871272
- DOI: 10.1002/hbm.20165
Repetition-induced changes in BOLD response reflect accumulation of neural activity
Abstract
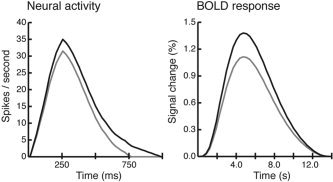
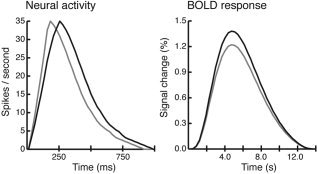
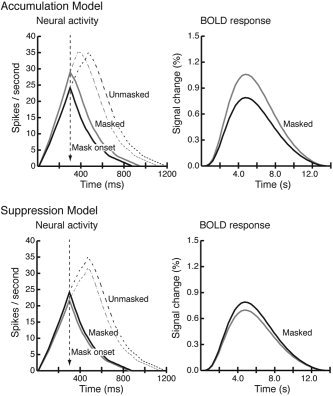
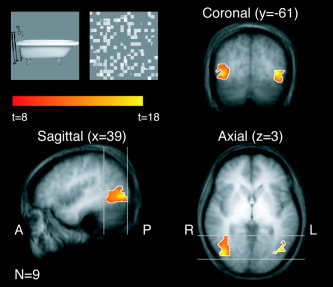
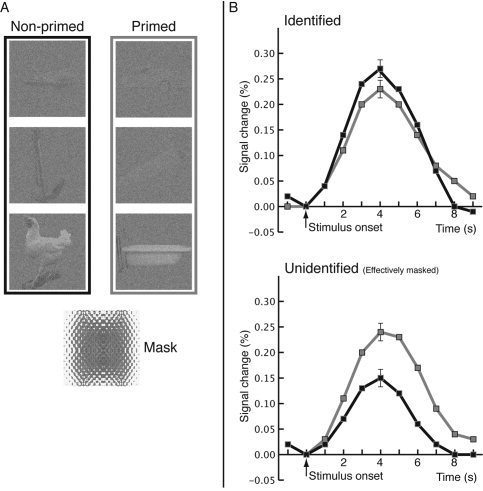
Recent exposure to a stimulus improves performance with subsequent identification of that same stimulus. This ubiquitous, yet simple, memory phenomenon is termed priming and has been linked to another widespread phenomenon called repetition suppression, which is a repetition-induced reduction in human brain activation as measured using fMRI. Here, competing models of the neural basis of repetition suppression were tested empirically. In a backward masking paradigm, we found that effectively masked object stimuli showed repetition enhancement of brain activation instead of suppression. This finding is consistent with an Accumulation model, but is inconsistent with a Suppression model of neural activity. Enhanced activation and the improved behavioral performance usually associated with priming are both explained by a shift in peak latency of the population neural activity elicited during identification.
Hum. Brain Mapping, 2005. (c) 2005 Wiley-Liss, Inc.
Figures
Similar articles
-
fMRI evidence of equivalent neural suppression by repetition and prior knowledge.Neuropsychologia. 2016 Sep;90:159-69. doi: 10.1016/j.neuropsychologia.2016.06.034. Epub 2016 Jul 25. Neuropsychologia. 2016. PMID: 27461077
-
Repetition suppression and multi-voxel pattern similarity differentially track implicit and explicit visual memory.J Neurosci. 2013 Sep 11;33(37):14749-57. doi: 10.1523/JNEUROSCI.4889-12.2013. J Neurosci. 2013. PMID: 24027275 Free PMC article.
-
Selective attention modulates neural substrates of repetition priming and "implicit" visual memory: suppressions and enhancements revealed by FMRI.J Cogn Neurosci. 2005 Aug;17(8):1245-60. doi: 10.1162/0898929055002409. J Cogn Neurosci. 2005. PMID: 16197681 Clinical Trial.
-
Neurochemical modulation of repetition suppression and novelty signals in the human brain.Cortex. 2016 Jul;80:161-73. doi: 10.1016/j.cortex.2015.10.013. Epub 2015 Nov 4. Cortex. 2016. PMID: 26625882 Review.
-
Neural response suppression, haemodynamic repetition effects, and behavioural priming.Neuropsychologia. 2003;41(3):263-70. doi: 10.1016/s0028-3932(02)00159-8. Neuropsychologia. 2003. PMID: 12457752 Review.
Cited by
-
Diverse Temporal Dynamics of Repetition Suppression Revealed by Intracranial Recordings in the Human Ventral Temporal Cortex.Cereb Cortex. 2020 Oct 1;30(11):5988-6003. doi: 10.1093/cercor/bhaa173. Cereb Cortex. 2020. PMID: 32583847 Free PMC article.
-
Characterising reward outcome signals in sensory cortex.Neuroimage. 2013 Dec;83:329-34. doi: 10.1016/j.neuroimage.2013.06.061. Epub 2013 Jun 27. Neuroimage. 2013. PMID: 23811411 Free PMC article.
-
Single-neuron mechanisms of neural adaptation in the human temporal lobe.Nat Commun. 2023 Apr 29;14(1):2496. doi: 10.1038/s41467-023-38190-5. Nat Commun. 2023. PMID: 37120437 Free PMC article.
-
Shape from sound: evidence for a shape operator in the lateral occipital cortex.Neuropsychologia. 2011 Jun;49(7):1807-15. doi: 10.1016/j.neuropsychologia.2011.03.004. Epub 2011 Mar 21. Neuropsychologia. 2011. PMID: 21397616 Free PMC article.
-
The functional anatomy of a perceptual decision in the human brain.J Neurophysiol. 2010 Mar;103(3):1179-94. doi: 10.1152/jn.00364.2009. Epub 2009 Dec 23. J Neurophysiol. 2010. PMID: 20032247 Free PMC article.
References
-
- Bar M, Tootell RBH, Schacter DL, Greve DN, Fischl BR, Mendola JD, Rosen BR, Dale AM (2001): Cortical mechanisms specific to explicit visual object recognition. Neuron 29: 529–535. - PubMed
-
- Becker S, Moscovitch MM, Behrmann M, Joordens S (1997): Long‐term semantic priming: a computational account and empirical evidence. J Exp Psychol Learn Mem Cogn 23: 1059–1082. - PubMed
-
- Bichot NP, Schall JD (1999): Effects of similarity and history on neural mechanisms of visual selection. Nat Neurosci 2: 549–554. - PubMed
MeSH terms
LinkOut - more resources
Full Text Sources
Medical
