. 2005 Nov 1;391(Pt 3):581-8.
doi: 10.1042/BJ20050507.

Weaning induces NOS-2 expression through NF-kappaB modulation in the lactating mammary gland: importance of GSH

Affiliations

Weaning induces NOS-2 expression through NF-kappaB modulation in the lactating mammary gland: importance of GSH

Rosa Zaragozá et al. Biochem J. .

Abstract

At the end of lactation the mammary gland undergoes involution, a process characterized by apoptosis of secretory cells and tissue remodelling. To gain insight into this process, we analysed the gene expression profile by oligonucleotide microarrays during lactation and after forced weaning. Up-regulation of inflammatory mediators and acute-phase response genes during weaning was found. Expression of IkappaBalpha (inhibitory kappaBalpha), a protein known to modulate NF-kappaB (nuclear factor-kappaB) nuclear translocation, was significantly up-regulated. On the other hand, there was a time-dependent degradation of IkappaBalpha protein levels in response to weaning, suggesting a role for NF-kappaB. Furthermore, we have demonstrated, using chromatin immunoprecipitation assays, binding of NF-kappaB to the NOS-2 (inducible nitric oxide synthase) promoter at the early onset of events triggered during weaning. The three isoforms of NOS are constitutively present in the lactating mammary gland; however, while NOS-2 mRNA and protein levels and, consequently, NO production are increased during weaning, NOS-3 protein levels are diminished. Western blot analyses have demonstrated that protein nitration is increased in the mammary gland during weaning, but this is limited to a few specific tyrosine-nitrated proteins. Interestingly, inhibition of GSH synthesis at the peak of lactation partially mimics these findings, highlighting the role of NO production and GSH depletion during involution.


Figures

Figure 1
Figure 1. Differential gene expression in mammary glands from control lactating rats and after weaning
(A) Three complementary microarray experiments show differential gene expression in mammary glands from rats after weaning compared with that in control lactating glands. Genes down- and up-regulated after weaning are represented by solid and empty bars respectively. Genes with a fold change in expression of ≥1.5 were classified according to the category of biological process in which they are involved, following the criteria of the Gene Ontology Consortium [26]. The number of entries in a category relative to the total number of entries in the RG-U34A chip is given in parentheses. (B) The profile of IκBα expression was studied in control mammary glands (C) and 8 h after weaning (W 8h.); the values are normalized mean probe intensities for the three microarray experiments. (C) Effects of weaning on IκBα and IκBβ protein levels. Western blot analysis of equal amounts (20 μg) of protein derived from control lactating mammary gland (C) and mammary glands 8 h (W 8h.) or 24 h (W 24h.) after weaning were probed with anti-IκBα and anti-IκBβ antibodies as described in the Experimental section.
Figure 2
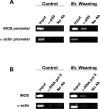
Figure 2. Analysis of NOS-2 gene expression in mammary glands from lactating rats and 8 h after weaning: in vivo NF-κB binding to the promoter and current transcription of the gene
Immunoprecipitation of formaldehyde-cross-linked chromatin was carried out using samples from control mammary glands (lactating) and 8 h after weaning with specific antibodies against the p65 subunit (A) or RNA polymerase II (B). Immunoprecipitates were aliquotted and subsequently analysed by PCR with specific primers for either the NOS-2 promoter (A) or the NOS-2 coding region to study the current transcription of the gene (RNA polymerase II ChIP assay; B). Total chromatin (Input) and samples containing no antibody (No Ab) were included in the PCR reactions. The PCR products obtained with oligonucleotides specific for the α-actin promoter and coding region were included as negative controls. Results are representative of three independent experiments.
Figure 3
Figure 3. NOS-2 mRNA expression in the mammary gland
Expression of NOS-2 (iNOS) mRNA in mammary glands from control lactating rats, rats after weaning and BSO-treated lactating rats was determined by real-time RT-PCR. GAPDH was used as an internal control (see the Experimental section). Results are means±S.E.M. from three independent experiments. ANOVA was performed for statistical analysis; different superscript letters indicate significant differences (P< 0.05), and the letter ‘a’ always represents the lowest value within the group.
Figure 4
Figure 4. Effects of weaning and BSO treatment on the levels of NOS-1, NOS-2 and NOS-3 in the mammary gland
Western blot analysis was performed using whole protein extracts (50 μg) derived from the mammary tissue of control lactating rats (C), rats 8 and 24 h after weaning (W 8h. and W 24h. respectively), rats 24 h after weaning followed by resuckling for a further 24 h (W+R 24h.) and rats treated with BSO over a period of 2 days (BSO 2d.). Extracts were probed with specific antibodies against NOS-1, NOS-2 and NOS-3 and with anti-α-tubulin. Results are means±S.E.M. for three independent experiments. Different superscript letters indicate significant differences (P<0.05); the letter ‘a’ always represents the lowest value within the group.
Figure 5
Figure 5. Determination of NO production in the mammary gland under various experimental conditions
NO production in the mammary gland in control lactating rats (C), rats 8 and 24 h after weaning (W 8 h. and W 24 h. respectively), rats 24 h after weaning followed by resuckling for a further 24 h (W+R 24h.) and BSO-treated rats (BSO 2d.) was determined by measuring the levels of nitrite in the mammary gland for at least three rats from each experimental group. Different superscript letters indicate significant differences (P<0.05); the letter ‘a’ always represents the lowest value within the group.
Figure 6
Figure 6. Nitration of proteins in the rat mammary gland
Total proteins (50 μg) extracted from the mammary tissue of control lactating rats (C), rats 8 and 24 h after weaning (W 8 h. and W 24 h. respectively), rats 24 h after weaning followed by resuckling for a further 24 h (W+R 24 h.) and rats treated with BSO over a period of 2 days (BSO 2d.) were resolved in 10% (w/v) polyacrylamide gels by reducing SDS/PAGE and examined by Western blot analysis with a monoclonal antibody against nitrotyrosine. Approximate sizes (kDa) were estimated using pre-stained molecular-mass markers (left). The arrows indicate proteins that are clearly nitrated on tyrosine. The Figure is representative of three independent experiments.

References

    1. Lund L. R., Romer J., Thomasset N., Solberg H., Pyke C., Bissell M. J., Dano K., Werb Z. Two distinct phases of apoptosis in mammary gland involution: proteinase-independent and -dependent pathways. Development. 1996;122:181–193. - PMC - PubMed
    1. Visvader J. E., Lindeman G. J. Transcriptional regulators in mammary gland development and cancer. Int. J. Biochem. Cell Biol. 2003;37:1034–1051. - PubMed
    1. Clarkson R. W. E., Watson C. J. Microarray analysis of the involution switch. J. Mammary Gland Biol. Neoplasia. 2003;8:309–319. - PubMed
    1. Clarkson R. W. E., Wayland M. T., Lee J., Freeman T., Watson C. J. Gene expression profiling of mammary gland development reveals putative roles for death receptors and immune mediators in post-lactational regression. Breast Cancer Res. 2004;6:R92–R109. - PMC - PubMed
    1. Stein T., Morris J. S., Davies C. R., Weber-Hall S. J., Duffy M.-A., Heath V. J., Bell A. K., Ferrier R. K., Sandilands G. P., Gusterson B. A. Involution of the mouse mammary gland is associated with an immune cascade and an acute-phase response, involving LBP, CD14 and STAT3. Breast Cancer Res. 2004;6:R75–R91. - PMC - PubMed

Publication types