. 2005 Jun 14:4:11.
doi: 10.1186/1476-069X-4-11.

Spatial analysis of lung, colorectal, and breast cancer on Cape Cod: an application of generalized additive models to case-control data

Affiliations

Spatial analysis of lung, colorectal, and breast cancer on Cape Cod: an application of generalized additive models to case-control data

Verónica Vieira et al. Environ Health. .

Abstract

Background: The availability of geographic information from cancer and birth defect registries has increased public demands for investigation of perceived disease clusters. Many neighborhood-level cluster investigations are methodologically problematic, while maps made from registry data often ignore latency and many known risk factors. Population-based case-control and cohort studies provide a stronger foundation for spatial epidemiology because potential confounders and disease latency can be addressed.

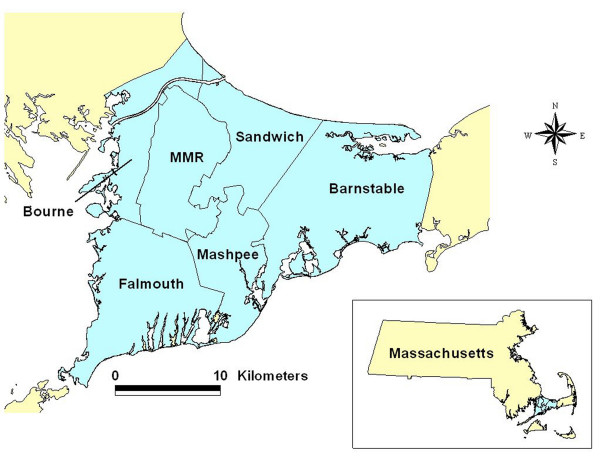
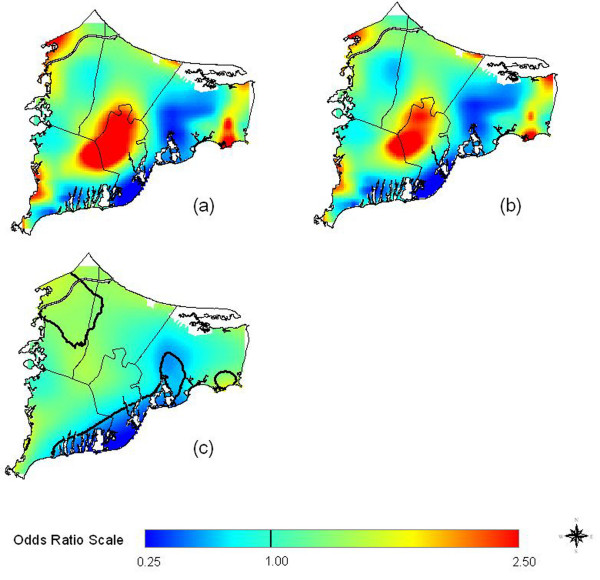
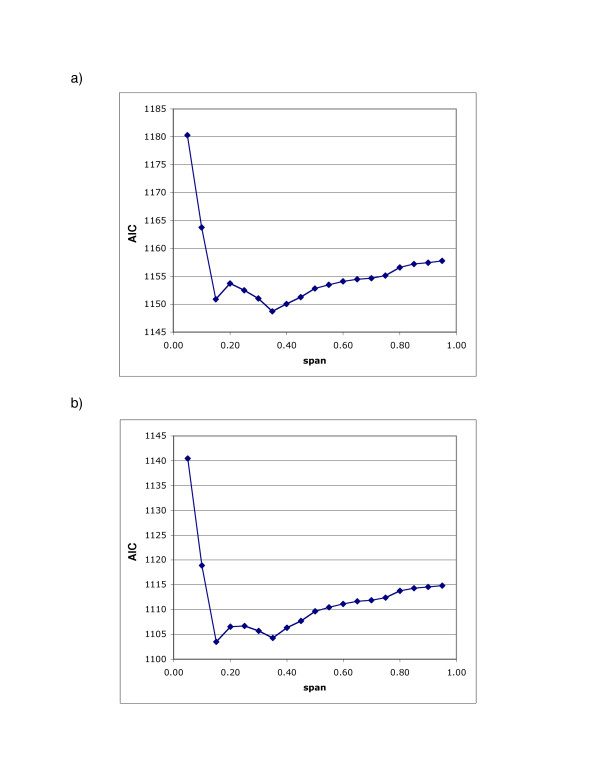
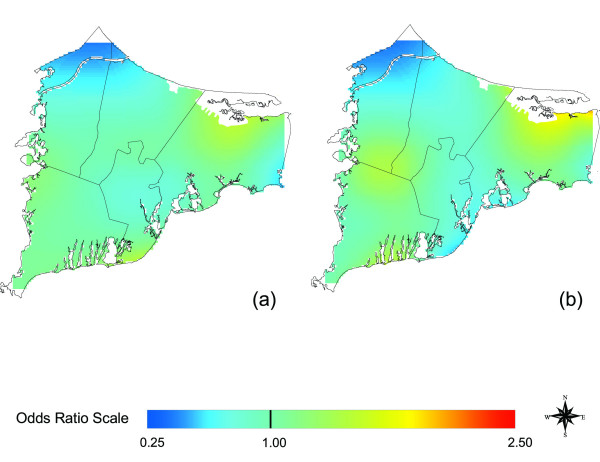
Methods: We investigated the association between residence and colorectal, lung, and breast cancer on upper Cape Cod, Massachusetts (USA) using extensive data on covariates and residential history from two case-control studies for 1983-1993. We generated maps using generalized additive models, smoothing on longitude and latitude while adjusting for covariates. The resulting continuous surface estimates disease rates relative to the whole study area. We used permutation tests to examine the overall importance of location in the model and identify areas of increased and decreased risk.

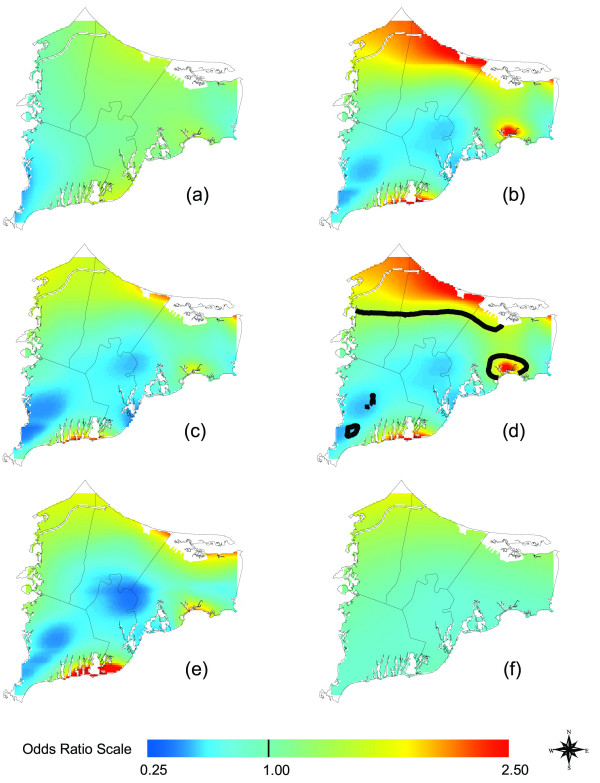
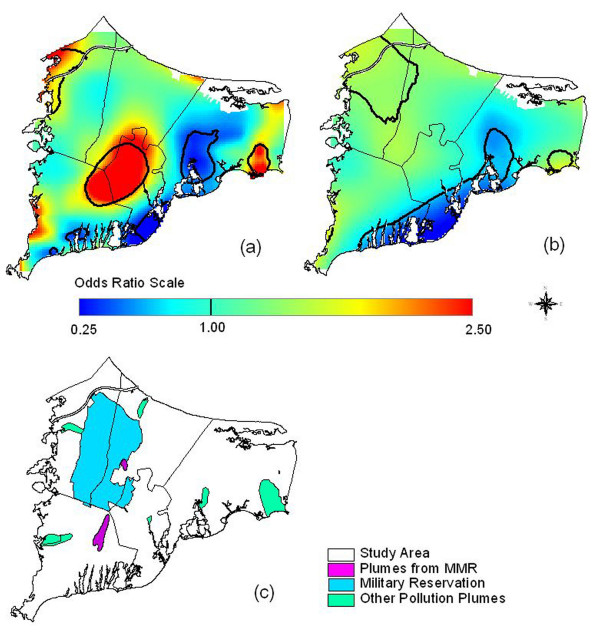
Results: Maps of colorectal cancer were relatively flat. Assuming 15 years of latency, lung cancer was significantly elevated just northeast of the Massachusetts Military Reservation, although the result did not hold when we restricted to residences of longest duration. Earlier non-spatial epidemiology had found a weak association between lung cancer and proximity to gun and mortar positions on the reservation. Breast cancer hot spots tended to increase in magnitude as we increased latency and adjusted for covariates, indicating that confounders were partly hiding these areas. Significant breast cancer hot spots were located near known groundwater plumes and the Massachusetts Military Reservation.

Discussion: Spatial epidemiology of population-based case-control studies addresses many methodological criticisms of cluster studies and generates new exposure hypotheses. Our results provide evidence for spatial clustering of breast cancer on upper Cape Cod. The analysis suggests further investigation of the potential association between breast cancer and pollution plumes based on detailed exposure modeling.


Figures

Figure 1
Figure 1
Geographic location of the upper Cape Cod study area. Cape Cod is located in Massachusetts in the northeast United States.
Figure 2
Figure 2
Distribution of cases and controls for lung, colorectal, and breast cancer. Each point represents the residence of one participant. Locations have been geographically altered to preserve confidentiality.
Figure 3
Figure 3
Breast Cancer Results. Odds ratios are relative to the whole study area. a) Adjusted, no latency. b) Adjusted. Assuming 15 years of latency somewhat increases spatial variation. c) Adjusted, 20 years of latency. Further increasing latency increases magnitude of hot and cold spots. d) Crude, 20 years of latency, created using the optimal span (0.15) of the adjusted map. Difference from the adjusted map indicates spatial confounding. e) Adjusted, 20 years of latency. Black contour lines denote areas of significantly increased and decreased risk at the 0.05 level.
Figure 4
Figure 4
Breast Cancer Results, Restricted to Longest Duration Residences. a) Adjusted, 20 years of latency. Restriction to residences of longest duration has little effect when the same span (0.15) is used as for all residences (Figure 3e). b) Use of the optimal span (0.45) for the restricted analysis increases the smoothness of the map.
Figure 5
Figure 5
Multiple Imputation of Missing Data had Little Effect on Breast Cancer Results. Adjusted, 20 years of Latency. a) Breast cancer map estimated using indicator variables to signify missing covariate data (Fig. 3c). b) We imputed missing data for covariates missing 10% or more of values. We generated six data sets, applying the GAM model to each. All maps (and their average) looked virtually identical; only one is shown, drawn using the same span (0.15) as the non-imputed map in a. c) Imputed map drawn using its optimal span of 0.35. Since the span is larger, it appears smoother than in b. The global statistics for all imputed maps were highly significant, regardless of span size. Black contour lines denote areas of significantly increased and decreased risk at the 0.05 level.
Figure 6
Figure 6
AIC Curves for the Imputed and Non-Imputed Breast Cancer Maps. Adjusted, 20 years of Latency. a) AIC curve for the imputed map. b) AIC curve for the non-imputed map. Both curves have local minima at span sizes of 0.15 and 0.35. Although quite similar in magnitude, the AIC value at 0.35 is slightly smaller than the value at 0.15 for the imputed map; the reverse is true for the non-imputed map. From a statistical point of view, both span sizes appear appropriate.
Figure 7
Figure 7
Lung Cancer Results. Odds ratios are relative to the whole study area. a) Adjusted, no latency. b) Adjusted, 15 years of latency. Increasing latency increases magnitude of hot and cold spots. c) Crude, 15 years of latency. Difference from the adjusted map indicates spatial confounding. The crude and adjusted maps have the same optimal span. d) Adjusted, 15 years of latency. Black contour lines denote areas of significantly increased and decreased risk at the 0.05 level. e) Adjusted, 15 years of latency. Restriction to residences of longest duration greatly changes the map compared to results for all residences even when the same span is used (0.3). f) Use of the optimal span (0.95) for the restricted analysis produces a very flat map.
Figure 8
Figure 8
Colorectal Cancer Results. Increasing latency from 0 years (a) to 15 years (b) shows little effect on adjusted odds ratios. Odds ratios are relative to the whole study area.
Figure 9
Figure 9
Groundwater plumes, the Massachusetts Military Reservation (MMR), and significant breast cancer hot spots. Adjusted, 20 years of Latency. Odds ratios are relative to the whole study area. a) Breast cancer map estimated using indicator variables to signify missing covariate data with an optimal span of 0.15 (Fig. 3c). b) Imputed map drawn using its optimal span of 0.35 (Fig. 5c). c) Location of the MMR and groundwater plumes from the MMR and other sources such as landfills. From a statistical point of view, both span sizes appear to be appropriate. However, because of the low population density around the military base, use of the larger span size tends to merge two "hot spots" in the center and the northwest corner of the map.

References

    1. Rothman K. A sobering start for the cluster busters' conference. Am J Epidemiol. 1990;132:S6–S13. - PubMed
    1. Polissar L. The effect of migration on comparison of disease rates in geographic studies in the United States. Am J Epidemiol. 1980;111:175–182. - PubMed
    1. Neutra RR. Counterpoint from a cluster buster. Am J Epidemiol. 1990;132:1–8. - PubMed
    1. Wartenberg D. Investigating disease clusters: Why, when, how? J Royal Statist Soc A. 2001;164:13–22. doi: 10.1111/1467-985X.00181. - DOI
    1. Aschengrau A, Ozonoff D. Upper Cape Cancer Incidence Study Final Report. Boston: Massachusetts Department of Public Health; 1992.

Publication types