Comparative Study
. 2005 Jun 20;201(12):1961-71.
doi: 10.1084/jem.20042407. Epub 2005 Jun 13.

Leukotriene B4, an activation product of mast cells, is a chemoattractant for their progenitors

Affiliations
Comparative Study

Leukotriene B4, an activation product of mast cells, is a chemoattractant for their progenitors

Charlotte L Weller et al. J Exp Med. .

Abstract

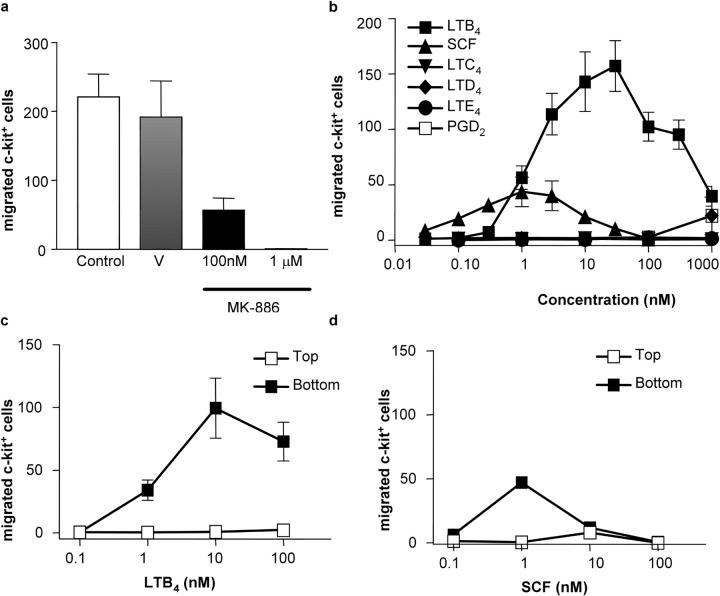
Mast cells are tissue-resident cells with important functions in allergy and inflammation. Pluripotential hematopoietic stem cells in the bone marrow give rise to committed mast cell progenitors that transit via the blood to tissues throughout the body, where they mature. Knowledge is limited about the factors that release mast cell progenitors from the bone marrow or recruit them to remote tissues. Mouse femoral bone marrow cells were cultured with IL-3 for 2 wk and a range of chemotactic agents were tested on the c-kit(+) population. Cells were remarkably refractory and no chemotaxis was induced by any chemokines tested. However, supernatants from activated mature mast cells induced pronounced chemotaxis, with the active principle identified as leukotriene (LT) B(4). Other activation products were inactive. LTB(4) was highly chemotactic for 2-wk-old cells, but not mature cells, correlating with a loss of mRNA for the LTB(4) receptor, BLT1. Immature cells also accumulated in vivo in response to intradermally injected LTB(4). Furthermore, LTB(4) was highly potent in attracting mast cell progenitors from freshly isolated bone marrow cell suspensions. Finally, LTB(4) was a potent chemoattractant for human cord blood-derived immature, but not mature, mast cells. These results suggest an autocrine role for LTB(4) in regulating tissue mast cell numbers.


Figures

Figure 1.
Figure 1.
Characterization of BMMC cultures. The percentage of c-kit+ cells in the total BMMC culture (a) and the mean fluorescence intensity of c-kit expression on the c-kit+ BMMCs (b) were measured by flow cytometry. Data shown are ±SEM (n = 9). (c) Representative dot plots showing double staining of 2-wk- (left), 6-wk- (middle), and 10-wk-old (right) BMMCs with anti–c-kit–PE (c-kit) and either IgE followed by anti-IgE–FITC (top, FcɛR1), anti-CD34–FITC (top middle, CD34), anti-T1/ST2–FITC (bottom middle, T1/ST2), or anti-CD13–FITC (bottom, CD13). Data shown are ±SEM (n = 6). (d) The mean fluorescence intensity of α4 and β7 integrins on c-kit+ BMMCs decreases from 1 to 10 wk. (e) Representative dot plots showing forward and side scatter of 2-wk- (left), 6-wk- (middle), and 10-wk-old (right) BMMCs. Data shown are ±SEM (n = 4).
Figure 2.
Figure 2.
Activated mast cell supernatants induce migration of 2-wk-old BMMCs. 10-wk-old BMMCs were either nonactivated (open bars) or activated through FcɛR1 cross-linking for 2 h (closed bars), and cell-free supernatants (undiluted [NEAT] or diluted at 1:3, 1:9, and 1:27) were added to the lower wells of a 96-well chemotaxis plate. BMMCs cultured for 2 (a) or 10 wk (b) were added to the top wells. After a 3-h incubation, migrated cells were removed from the wells, double stained with anti–c-kit–PE and anti–Gr-1–FITC, and c-kit+ BMMCs were counted by flow cytometry. No cells migrated to assay buffer alone. Data are mean ± SEM (n = 3) for 10-wk-old cultures to generate the supernatants.
Figure 3.
Figure 3.
HPLC of the mast cell progenitor chemoattractant activity released by mature mast cells. 10-wk-old BMMCs were either activated via FcɛR1 cross-linking for 2 h (top), or nonactivated (bottom), and the supernatants applied to reversed phase HPLC. Fractions were tested for chemotaxis of c-kit+ 2-wk-old BMMCs. This result is representative of two independent experiments using supernatants from different 10-wk-old BMMC cultures tested on different 2-wk-old cultures. Arrows indicate the elution of LT (B4, C4, D4, E4, and 20-hydroxy-LTB4) and non-LT (histamine [H], 5-hydroxy tryptamine [5-HT], and PGD2) standards.
Figure 4.
Figure 4.
LTB4 is chemotactic for 2-wk-old BMMCs. (a) 10-wk-old BMMCs were activated through FcɛR1 cross-linking for 2 h after pretreatment for 10 min at 37°C with a 5-LO inhibitor (black bars, MK-886), vehicle alone (gray bar, V), or buffer (open bar, control). Cell supernatants were added to the lower wells of chemotaxis plates at a 1:9 dilution and 2-wk-old BMMCs were added to the upper wells. After 3 h, migrated cells were removed from the wells and c-kit+ BMMC migration was counted. MK-886 inhibited migration of 2-wk-old BMMCs at 100 nM and 1 μM (P < 0.05). Data are ±SEM (n = 3). (b) SCF (0.1–100 nM), LTB4, LTC4, LTD4, LTE4, and PGD2 (0.1–1,000 nM) were tested for their ability to induce migration of 2-wk-old BMMCs. LTB4 and SCF induced migration of 2-wk-old BMMCs, but LTC4, LTD4, LTE4, and PGD2 induced no migration. Data are mean ± SEM for LTB4 and SCF (n = 8), LTC4 (n = 4), and LTD4, LTE4, and PGD2 (n = 3). LTB4 (c) or SCF (d) were added to either the top or the bottom wells of a 96-well chemotaxis plate and 2-wk-old BMMCs were added to the top wells. Migrated cells were removed and c-kit+ BMMCs counted. Data are mean ± SEM (n = 3). No cells migrated to assay buffer alone in any experiment.
Figure 5.
Figure 5.
LTB4 is a more efficacious chemoattractant for 2-wk-old than for 6- or 10-wk-old BMMCs. LTB4 (a) or SCF (b) were added to the bottom wells of a 96-well chemotaxis plate and 2-, 6-, and 10-wk-old BMMCs were added to the top wells. After 3 h, migrated cells were removed, stained, and c-kit+ BMMCs were counted. No cells migrated to assay buffer alone. Data are mean ± SEM for 2- and 10-wk-old BMMCs (n = 6), and 6-wk-old BMMCs (n = 4).
Figure 6.
Figure 6.
Expression of BLT1 mRNA in c-kit+ 2-wk-old BMMCs. (a) BLT1 mRNA expression, analyzed by RT-PCR and compared with the housekeeping gene GAPDH, was higher in 2-wk-old than in either 6- or 10-wk-old BMMCs. The result is representative of three independent experiments using RNA isolated from separate cell cultures. (b) Real-time PCR analysis of BLT1 mRNA expression in 2-, 6-, and 10-wk-old BMMCs. Fold increases in BLT1 mRNA in BMMCs were normalized to GAPDH, with an internal 18S control to which both GAPDH and BLT1 were normalized. 2-wk-old BMMCs expressed more BLT1 mRNA than 6- or 10-wk-old BMMCs (P < 0.05). Data are mean ± SEM (n = 3) using RNA isolated from separate cell cultures.
Figure 7.
Figure 7.
Freshly isolated bone marrow cells that migrate in response to LTB4 develop into mMCP-1– and -2–expressing mature mast cells. LTB4 and SCF were added to the bottom wells of a 96-well chemotaxis plate, and freshly isolated bone marrow cells were added to the top wells. After a 3-h incubation, migrated cells were cultured for 14 d in the presence of TGF-β1, SCF, IL-3, and IL-9. On day 14, cells were frozen, lysed, and assayed for levels of mMCP-1 (a) and -2 (b). LTB4 -induced migration of cells that developed into mMCP-1– and -2–expressing cells (mast cells), but SCF did not induce migration of this cell population. Migration to buffer alone gave mMCP-1 and mMCP-2 values below the detection limits of the assays (>0.04 ng/ml). Data are mean ± SEM (n = 3) for different bone marrow cell preparations.
Figure 8.
Figure 8.
Localization of prelabeled BMMCs in mouse skin in response to i.d. LTB4. (a) Increased numbers of CMFDA-labeled BMMCs (negative selection) in skin injected with 150 pmol LTB4 compared with vehicle control sites. Data are mean ± SEM (n = 4; P < 0.05). (b–d) Representative confocal micrographs of whole-mount mouse skin. Prelabeled CMFDA-labeled BMMCs are green in skin samples counter-stained with GSL-1 Isolectin B4, staining endothelium, and neutrophils red. (b) Vehicle control (negative BMMC selection). (c) LTB4 injection site showing extravascular CMFDA-labeled BMMCs and capillaries of 4–6-μm diameter (negative BMMC selection). (d) LTB4 injection site showing CMFDA-labeled BMMCs migrating from venules of 18–25 μm (positive BMMC selection). Bars, 20 μm.
Figure 9.
Figure 9.
LTB4 induces migration of immature, but not mature, human CBMCs. (a) Representative histogram of CBMCs cultured for 7 wk and stained with anti–human c-kit–PE (open histogram) or isotype control (shaded histogram). Two populations of c-kit–expressing mast cells can be seen (c-kit+ and c-kithigh). (b and c) Histograms showing that FcɛR1 expression (open histogram) is detectable above the control antibody (shaded histogram) on both c-kit+ and c-kithigh cells. (d and e) Representative dot plots showing forward and side scatter of the c-kit+ and c-kithigh cells. Migration of 5–7 wk c-kit+ (f) and c-kithigh (g) mast cells to LTB4 and SCF. Migrated cells were stained with anti–human c-kit–PE and anti–human CD14–FITC and counted. Migration to assay buffer alone was 4.5 ± 1.4% c-kit+ cells and 0.7 ± 0.15% c-kithigh cells. Data are mean ± SEM (n = 5) using cells cultured from separate donors.

Similar articles

Cited by

References

    1. Marshall, J.S. 2004. Mast-cell responses to pathogens. Nat. Rev. Immunol. 4:787–799. - PubMed
    1. Kitamura, Y., S. Go, and K. Hatanaka. 1978. Decrease of mast cells in W/Wv mice and their increase by bone marrow transplantation. Blood. 52:447–452. - PubMed
    1. Reynolds, D.S., R.L. Stevens, W.S. Lane, M.H. Carr, K.F. Austen, and W.E. Serafin. 1990. Different mouse mast cell populations express various combinations of at least six distinct mast cell serine proteases. Proc. Natl. Acad. Sci. USA. 87:3230–3234. - PMC - PubMed
    1. Wong, G.W., S. Yasuda, N. Morokawa, L. Li, and R.L. Stevens. 2004. Mouse chromosome 17A3.3 contains 13 genes that encode functional tryptic-like serine proteases with distinct tissue and cell expression patterns. J. Biol. Chem. 279:2438–2452. - PubMed
    1. Miller, H.R., and A.D. Pemberton. 2002. Tissue-specific expression of mast cell granule serine proteinases and their role in inflammation in the lung and gut. Immunology. 105:375–390. - PMC - PubMed

Publication types

MeSH terms