. 2005 Jun 20;169(6):885-96.
doi: 10.1083/jcb.200409150. Epub 2005 Jun 13.

G protein beta interacts with the glucocorticoid receptor and suppresses its transcriptional activity in the nucleus

Affiliations

G protein beta interacts with the glucocorticoid receptor and suppresses its transcriptional activity in the nucleus

Tomoshige Kino et al. J Cell Biol. .

Abstract

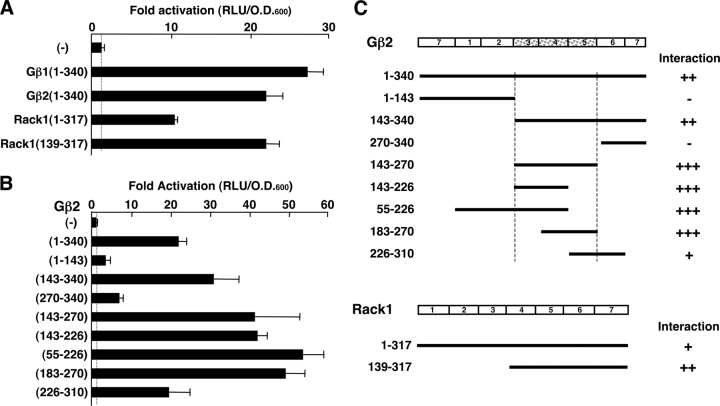
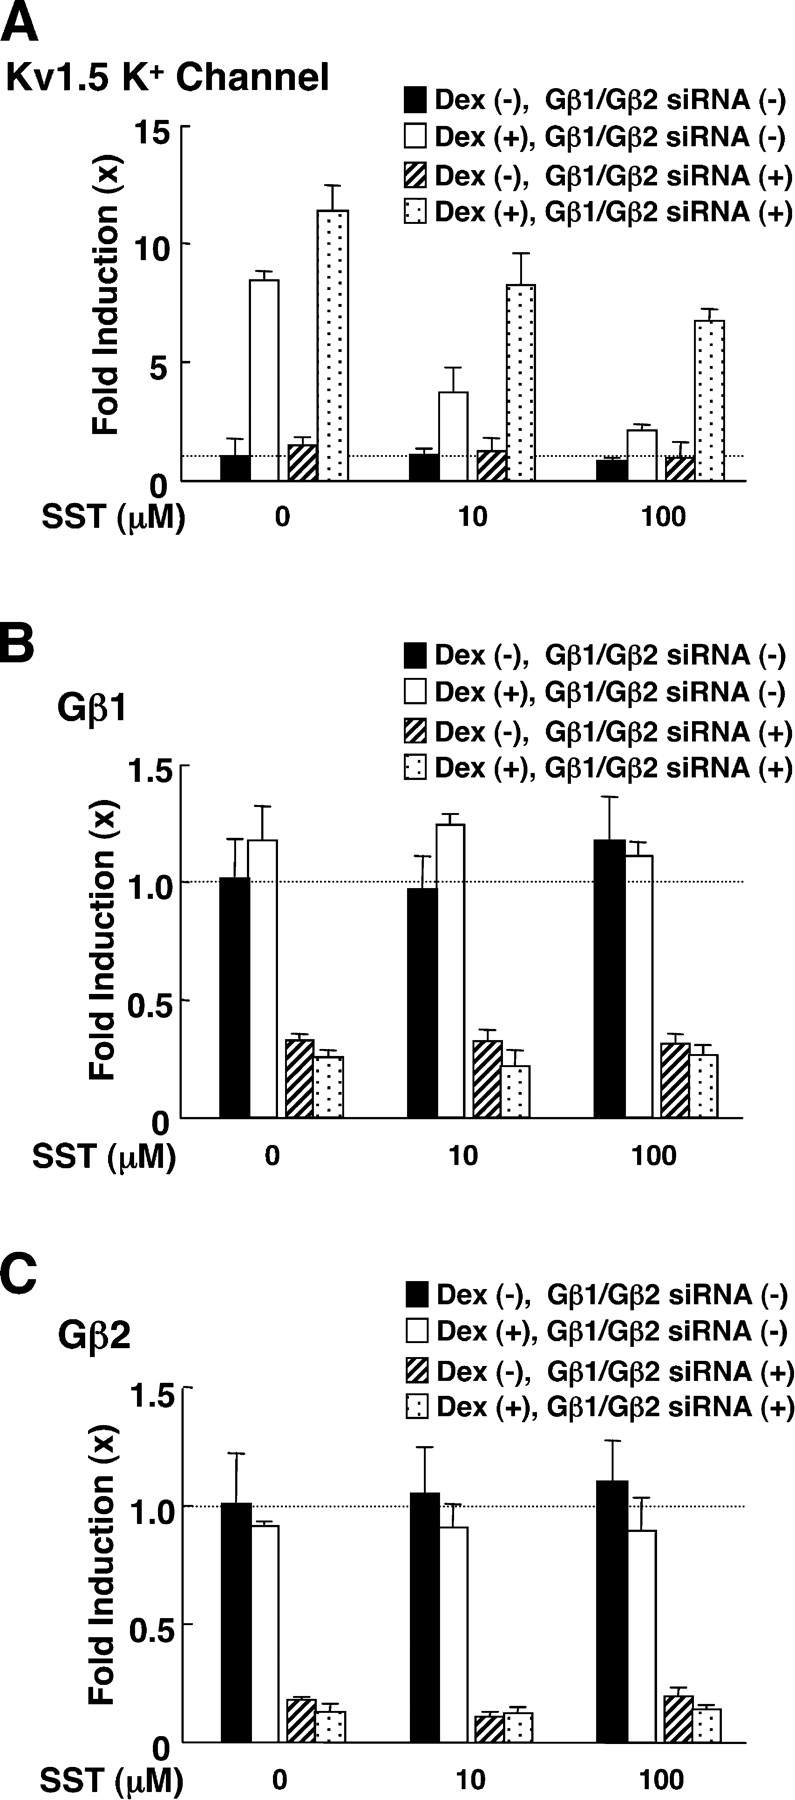
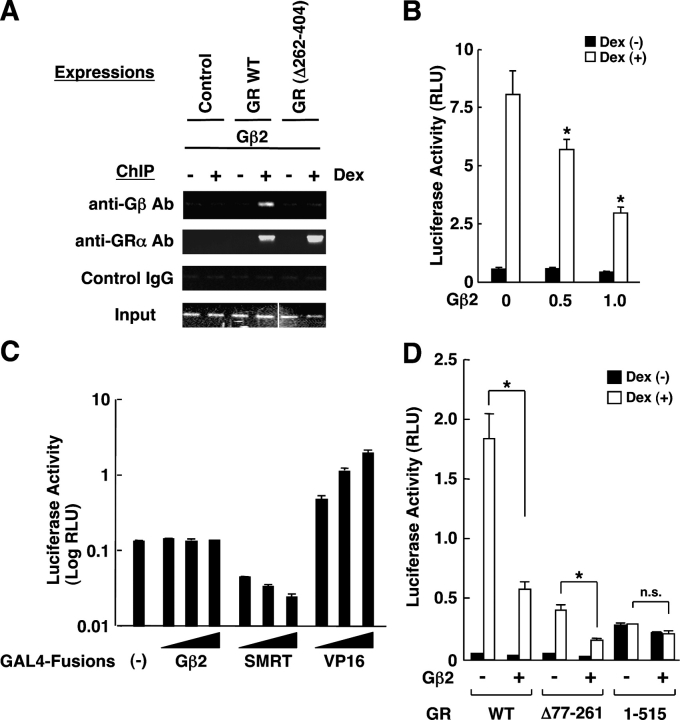
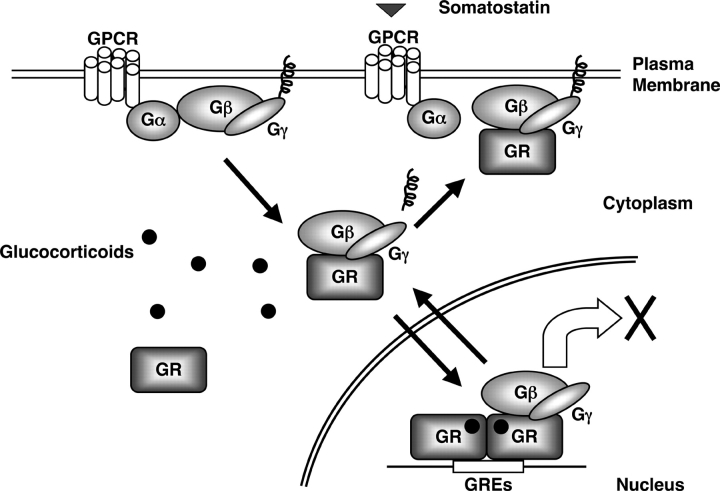
Extracellular stimuli that activate cell surface receptors modulate glucocorticoid actions via as yet unclear mechanisms. Here, we report that the guanine nucleotide-binding protein (G protein)-coupled receptor-activated WD-repeat Gbeta interacts with the glucocorticoid receptor (GR), comigrates with it into the nucleus and suppresses GR-induced transactivation of the glucocorticoid-responsive genes. Association of Ggamma with Gbeta is necessary for this action of Gbeta. Both endogenous and enhanced green fluorescent protein (EGFP)-fused Gbeta2 and Ggamma2 proteins were detected in the nucleus at baseline, whereas a fraction of EGFP-Gbeta2 and DsRed2-GR comigrated to the nucleus or the plasma membrane, depending on the exposure of cells to dexamethasone or somatostatin, respectively. Gbeta2 was associated with GR/glucocorticoid response elements (GREs) in vivo and suppressed activation function-2-directed transcriptional activity of the GR. We conclude that the Gbetagamma complex interacts with the GR and suppresses its transcriptional activity by associating with the transcriptional complex formed on GR-responsive promoters.


Figures

Figure 1.
Figure 1.
Gβ1, Gβ2 and Rack1 interact with GR(263-419) in yeast two-hybrid assays. (A) Full-length Gβ1, Gβ2, and Rack1, as well as Rack1(139-317) interact with GR(263-420) in a yeast two-hybrid assay. EGY48 yeast cells were transformed with p8OP-LacZ, pLexA-GRα(263-419) and the indicated full-length Gβ1-, Gβ2-, Rack1-, or Rack1(139-317)-expressing pB42AD-derived plasmids. Bars represent mean ± SEM values of fold activation compared with the baseline. (B) Gβ2(143-270) (blades 3–5) interacts with GR(263-420) in a yeast two-hybrid assay. EGY48 yeast cells were transformed with p8OP-LacZ, pLexA-GRα(263-419) and the indicated Gβ2 fragment-expressing pB42AD plasmids. Bars represent mean ± SEM values of fold activation compared with the baseline. (C) Summary of yeast two-hybrid assays, which demonstrates domains of Gβ2 and Rack1 that are necessary for the interaction with GR(263-419).
Figure 2.
Figure 2.
Gβ1, Gβ2, and Rack1 suppress the transcriptional activity of GR on the MMTV promoter, and endogenous Gβ and Gγ are associated with GR in vivo. (A) Gβ1, Gβ2, and Rack1 dose dependently suppress the transcriptional activity of GR on the MMTV promoter in HCT116 cells. HCT116 cells were transfected with indicated amounts of Gβ1, Gβ2, or Rack1-expressing plasmids together with pRShGRα, pMMTV-Luc, and pSV40-β-Gal. Bars represent mean ± SEM values of the luciferase activity normalized for β-galactosidase activity in the absence or presence of 10−6 M of dexamethasone. (B) GR(Δ262-404) has stronger transcriptional activity than the wild-type GR and Gβ2 loses its suppressive effect on GR(Δ262-404)-induced transactivation in HCT116 cells. HCT116 cells were transfected with Gβ2-expressing plasmids and pRShGRα or pRShGRα(Δ262-404), together with pMMTV-Luc and pSV40-β-Gal. Bars represent mean ± SEM values of the luciferase activity normalized for β-galactosidase activity in the absence or presence of 10−6 M of dexamethasone. (*), P < 0.01; n.s., not significant, compared with the baseline. (C) Expression of Gβ2 shifts the dexamethasone titration curve of the luciferase activity from the pMMTV-Luc in HCT116 cells. HCT116 cells were transfected with pRShGRα, pMMTV-Luc, and pSV40-β-Gal in the absence or presence of Gβ2-expressing plasmid. Cells were then stimulated with increasing concentrations of dexamethasone. Open and closed circles represent mean ± SEM values of the luciferase activity normalized for β-galactosidase activity in the absence (open circle) or presence (closed circle) of the Gβ2 expression. (D–F) Abrogation of Gβ1 and Gβ2 enhanced dexamethasone-activated TAT activity (D) and suppressed mRNA (E) and protein (F) levels of Gβ1 and Gβ2 in HTC cells. HTC cells were transfected with control or Gβ1 and Gβ2 siRNAs and the cells were treated with 10−6 M of dexamethasone for 24 h. Cell lysate and total RNA were harvested and the TAT activity (D), Gβ1 and Gβ2 mRNA abundance (E) and protein levels of Gβ1 and Gβ2 in Western blots using their specific antibodies in the absence of dexamethasone (F), were determined. Bars represent mean ± SEM values of TAT activity (D) or fold induction of Gβ1 or Gβ2 mRNAs (E) in the absence or presence of 10−6 M of dexamethasone. (*), P < 0.01; n.s., not significant, compared with the baseline. (G) Endogenous Gβ and Gγ, but not Gαi, are associated with GR in vivo. HeLa cells were stimulated with 10−6 M of dexamethasone and coimmunoprecipitation was performed with control or anti-GRα antibody. After blotting the precipitated proteins on nitrocellulose membranes, the associated Gβ, Gγ, or Gαi was detected with their specific antibodies. Expression of Gβ, Gγ, Gαi, and GR was also examined in 10% whole homogenates in Western blots.
Figure 3.
Figure 3.
Somatostatin suppressed dexamethasone-stimulated transcriptional activity of the Kv1.5 potassium channel gene, whereas abrogation of Gβ1 and Gβ2 attenuated the somatostatin effect in GH3 cells. GH3 cells were transfected with control or Gβ1 and Gβ2 siRNAs, and were treated with 10−6 M of dexamethasone and/or the indicated amounts of somatostatin for 24 h. Total RNA was then purified from the cells and the amounts of Kv1.5 potassium channel (A), Gβ1 (B), Gβ2 (C), or RPLP0 mRNAs were determined by RT-PCR. Bars show mean ± SEM of their fold induction over baseline.
Figure 4.
Figure 4.
Subcellular localization of Gβ2 and Gγ2 in HCT116 cells. (A) Endogenous Gβ and Gγ are visualized in the nucleus as well as in the cytoplasm/plasma membrane in HCT116 cells. Endogenous Gβ (left, top two panels) and Gγ (right, top two panels) were visualized by treatment with anti-Gβ or -Gγ2 antibodies, and FITC-labeled secondary antibody, and their confocal images were obtained. Nuclei were also stained with DAPI. Co-treatment of the samples with blocking peptides for anti-Gβ (left, bottom) or anti-Gγ2 (right, bottom) antibodies abolished their specific staining. Cells, expressing Gβ or Gγ exclusively in the cytoplasm, are indicated as “ℵ” and “a”, respectively, whereas cells retaining these molecules weakly or strongly in the nucleus are indicated as “ℑ” and “b”, and “ℜ” and “c”, respectively. (B) Endogenous Gβ and Gγ are detected in the nuclear fraction as well as in the cytoplasm and membrane fractions in HCT116 cells. HCT116 cells were lysed and their subcellular fractions were separated by centrifugation. 0.1 μg of protein of indicated subcellular fractions was run on SDS-PAGE gels, blotted to the nitrocellulose membranes, and Gβ and Gγ were visualized with their specific antibodies by reprobing the same membrane. Intracellular adhesion molecule 1 (ICAM1), α-tubulin, and Oct1, detected also by reprobing the same membrane with their specific antibodies, were respectively shown as positive controls for the membrane, cytoplasmic and nuclear fractions to indicate that the subcellular fractionation did not produce cross-contamination. (C and D) EGFP-Gβ2 was localized in the nucleus in addition to the cytoplasm, whereas EGFP-Gγ2 was detected in the nucleus and the cytoplasm, and at the plasma membrane in HCT116 cells. HCT116 cells were transfected with pEGFP-C-1-Gβ2 or -Gγ2, and the cells were fixed and their confocal images were obtained. Nuclei were also stained with DAPI. Representative images of EGFP-Gβ2 and -Gγ2 are respectively shown in C, whereas mean ± SEM values of their signal intensities in the nucleus and the cytoplasm obtained from over 20 cells are shown in D. (E and F) EGFP-Gβ2 translocated into the nucleus with DsRed2-GR in response to 10−6 M of dexamethasone in HCT116 cells. HCT116 cells were transfected with pEGFP-C1-Gβ2 and pDsRed2-GRα. Confocal images of EGFP-Gβ2 and DsRed2-GR were obtained before and 30 min after the treatment with 10−6 M of dexamethasone. Representative images are shown in D, whereas mean ± SEM values of signal intensities in the nucleus (black bars) and the cytoplasm (white bars) obtained from over 20 cells is shown in E. (G) EGFP-Gβ2 and DsRed2-GR are colocalized at the plasma membrane in response to somatostatin in HCT116 cells. HCT116 cells were transfected with pEGFP-C1-Gβ2, pDSRed2-GRα, and Gγ2- and SSTR2-expressing plasmids. Confocal images of EGFP-Gβ2 and DsRed2-GR were obtained before and 30 min after the treatment with 100 nM of somatostatin. Blue and orange arrows indicate signals of EGFP-Gβ2, DsRed2-GR, which are localized at the plasma membrane, whereas yellow arrows indicate their colocalization.
Figure 5.
Figure 5.
Forced cytoplasmic localization of Gβ2 attenuates the suppressive effect of the wild-type Gβ on GR-induced transactivation, whereas forced nuclear localization enhances it. (A and B) EGFP-fused NES-Gβ2 and NLS-Gβ2 are exclusively localized in the cytoplasm and the nucleus, respectively, in HCT116 cells. HCT116 cells were transfected with pEGFP-C1-NES-Gβ2- or pEGFP-C1-NLS-Gβ2-expressing plasmid. The cells were fixed and their confocal images were obtained. Representative images are shown in A, whereas mean ± SEM values of signal intensities in the nucleus (black bars) and the cytoplasm (white bars) obtained from over 20 cells are shown in B. (C) NES-Gβ2 loses the suppressive effect on GR transactivation, whereas NLS-Gβ2 has a stronger inhibitory effect than the wild-type Gβ2 on GR transactivation in HCT116 cells. HCT116 cells were transfected with pCDNA4His/MaxB-NES-Gβ2- or -NLS-Gβ2 together with pRShGRα, pMMTV-Luc, and pSV40-β-Gal. Bars represent mean ± SEM values of the luciferase activity normalized for β-galactosidase activity in the absence or presence of 10−6 M of dexamethasone. (*), P < 0.01; n.s., not significant, compared with the baseline. (D) Gβ2 wild-type and its fusions with NES or NLS are similarly expressed in HCT116 cells. HCT116 cells were transfected with pCDNA4His/MaxB-Gβ2, -NES-Gβ2-, or -NLS-Gβ2. The cells were lysed and the expression of wild-type, NES-, and NLS-fused Gβ2 was examined in a Western blots using anti-His antibody.
Figure 6.
Figure 6.
Gβ2 is attracted to GREs and directly suppresses GR-induced transactivation by inhibiting its AF-2 function. (A) Gβ2 was attracted to the chromatin-integrated MMTV GREs via interaction with GR in COS7 cells. COS7 cells, which have genomically integrated MMTV-Luc, were transfected with Gβ2-expressing plasmid and pRShGRα or pRShGRα(Δ262-404). 24 h after addition of 10−6 M of dexamethasone, the cells were fixed and the ChIP reaction was performed with anti-Gβ or control antibodies. The portion of the MMTV promoter that contains two GREs was amplified by PCR with a specific primer pair. Two images obtained from separate gels were combined to produce the Input gel image. (B) Gβ2 suppresses the transcriptional activity of GR on the chromatin-integrated MMTV promoter in COS7 cells. COS7 cells with genomically integrated MMTV-Luc, were transfected with the indicated amounts of the Gβ2-expressing plasmid, together with pRShGRα and pSV40-β-Gal. Bars represent mean ± SEM values of the luciferase activity normalized for β-galactosidase activity in the absence or presence of 10−6 M of dexamethasone. (*), P < 0.01, compared with the baseline. (C) Gβ2 does not have intrinsic transcriptional activity. HCT116 cells were transfected with increasing amounts of GAL4 DBD-fused Gβ2-, SMRT-, or VP16-expressing plasmid together with pGAL4-E1B-Luc and pSV40-β-Gal. Bars represent mean ± SEM values of the luciferase activity normalized for β-galactosidase activity. (D) Gβ2 suppresses the AF2-directed transcriptional activity of GR, but not the AF-1–dependent transactivation in HCT116 cells. HCT116 cells were transfected with Gβ2-expressing plasmid, pMMTV-Luc, and pSV40-β-Gal together with pRShGRα, pRShGRα(Δ77-261), or pRShGRα(1-515). Bars represent mean ± SEM values of the luciferase activity normalized for β-galactosidase activity in the absence or presence of 10−6 M of dexamethasone. (*), P < 0.01; n.s., not significant, compared with the baseline.
Figure 7.
Figure 7.
Interactions between the glucocorticoid and GPCR signaling systems at the level of the GR and the Gβ/Gγ subunits. In response to activation of a GPCR and the GR by their respective ligands, the Gβ/Gγ complex interacts with the GR and translocates with it into the cell nucleus where it suppresses glucocorticoid-induced transactivation. The inactivated Gβ/Gγ complex, normally located under the plasma membrane, may serve as an anchor to the nonligand-activated GR.

Similar articles

Cited by

References

    1. Brown, P.J., and A. Schonbrunn. 1993. Affinity purification of a somatostatin receptor-G-protein complex demonstrates specificity in receptor-G-protein coupling. J. Biol. Chem. 268:6668–6676. - PubMed
    1. Cabrera-Vera, T.M., J. Vanhauwe, T.O. Thomas, M. Medkova, A. Preininger, M.R. Mazzoni, and H.E. Hamm. 2003. Insights into G protein structure, function, and regulation. Endocr. Rev. 24:765–781. - PubMed
    1. Chang, B.Y., M. Chiang, and C.A. Cartwright. 2001. The interaction of Src and RACK1 is enhanced by activation of protein kinase C and tyrosine phosphorylation of RACK1. J. Biol. Chem. 276:20346–20356. - PubMed
    1. Chen, S., E.J. Dell, F. Lin, J. Sai, and H.E. Hamm. 2004. RACK1 regulates specific functions of Gbetagamma. J. Biol. Chem. 279:17861–17868. - PubMed
    1. Chrousos, G.P. 1995. The hypothalamic-pituitary-adrenal axis and immune-mediated inflammation. N. Engl. J. Med. 332:1351–1362. - PubMed

MeSH terms