. 2005 Jul;126(1):7-21.
doi: 10.1085/jgp.200509262. Epub 2005 Jun 13.

Heme regulates allosteric activation of the Slo1 BK channel

Affiliations

Heme regulates allosteric activation of the Slo1 BK channel

Frank T Horrigan et al. J Gen Physiol. 2005 Jul.

Abstract

Large conductance calcium-dependent (Slo1 BK) channels are allosterically activated by membrane depolarization and divalent cations, and possess a rich modulatory repertoire. Recently, intracellular heme has been identified as a potent regulator of Slo1 BK channels (Tang, X.D., R. Xu, M.F. Reynolds, M.L. Garcia, S.H. Heinemann, and T. Hoshi. 2003. Nature. 425:531-535). Here we investigated the mechanism of the regulatory action of heme on heterologously expressed Slo1 BK channels by separating the influences of voltage and divalent cations. In the absence of divalent cations, heme generally decreased ionic currents by shifting the channel's G-V curve toward more depolarized voltages and by rendering the curve less steep. In contrast, gating currents remained largely unaffected by heme. Simulations suggest that a decrease in the strength of allosteric coupling between the voltage sensor and the activation gate and a concomitant stabilization of the open state account for the essential features of the heme action in the absence of divalent ions. At saturating levels of divalent cations, heme remained similarly effective with its influence on the G-V simulated by weakening the coupling of both Ca(2+) binding and voltage sensor activation to channel opening. The results thus show that heme dampens the influence of allosteric activators on the activation gate of the Slo1 BK channel. To account for these effects, we consider the possibility that heme binding alters the structure of the RCK gating ring and thereby disrupts both Ca(2+)- and voltage-dependent gating as well as intrinsic stability of the open state.


Figures

Figure 1.
Figure 1.
Allosteric gating model of Slo1 in the absence of divalent ions proposed by Horrigan et al. (1999). (A) HCA model with individual rate constants. (B) HCA model using equilibrium constants. The allosteric factor D is defined as D = f2, the weakly voltage-dependent open–closed equilibrium constant is defined as L0 = δ00 at 0 mV, and the strongly voltage-dependent equilibrium constant J is defined as J = α/β at 0 mV. For details, see Horrigan et al. (1999). The most likely activation pathway on moderate to large depolarization is C0-C1-C2-C3-C4-O4 and the most likely deactivation pathway on repolarization to a very negative voltage is O4-O3-O2-O1-O0-C0.
Figure 2.
Figure 2.
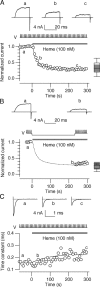
Time course of Slo1 inhibition by heme in the absence of divalent ions. (A) Heme (100 nM) progressively reduced Slo1 currents elicited by pulses from 0 to 160 mV every 6 s. The normalized macroscopic conductance is ∼0.5 at this voltage. The scaled peak current amplitude is plotted as a function of time. Representative sweeps obtained at different times (a, b, and c) are also shown. The smooth curve is a single exponential fit to the data with a time constant of 24 s. The boxplot on the right summarizes the fractional inhibition of currents from 17 patches. (B) Inhibitory effect of heme (100 nM) persists without depolarization. The patch was held at −80 mV during the first 4 min after heme application. The dashed curve represents the exponential fit to the data shown in A. (C) Heme (100 nM) slows the tail current time course at −100 mV. The smooth curve is a single exponential curve with a time constant of 10 s. The data were obtained from the same patch as in A. Inset shows representative tail currents obtained at different times (a, b, and c).
Figure 3.
Figure 3.
Open-channel i–V is not markedly altered by heme. (A) Channel openings elicited by ramp depolarization from 0 to 240 mV in the control condition (left) and with 100 nM heme (right). The sweeps designated by 1 and 2 show the main conductance level. The sweep designated by 3 shows the 60% substate and that by 4 illustrates the 40% substate. (B) Composite i-V curves obtained by conditional averaging of many openings as shown in A.
Figure 4.
Figure 4.
Slo1 channels open with depolarization in the presence of heme. (A) Representative Slo1 currents recorded at different voltages before and after application of heme (100 nM; thick sweeps, denoted with •). (B) Representative peak I–V curves obtained from outward currents. (C) Representative normalized macroscopic G–V curves obtained from tail currents. The smooth lines represent Boltzmann fits to the data. The values of V0.5 and Qapp for the control group were 160 mV and 1.2 e and those for the heme group were 198 mV and 0.77 e (see Fig. 6 for more). (D) Scaled tail currents at −180 mV following pulses to 120 to 220 mV in 10 mV increments before (left) and after (right) application of heme (100 nM). In each condition, the currents, 11 sweeps, essentially superimpose and the currents recorded with heme are slower than the control currents. The dotted trace in right shows the tail current time course in the control condition without heme. Data in A, B, and C are from the same patch.
Figure 5.
Figure 5.
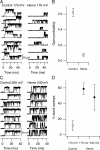
Inhibition of single-channel openings by heme. (A) Representative openings elicited by pulses to 170 mV before and after application of heme (100 nM). Pulses were applied every 2 s. (B) Decrease in the peak open probability at 170 mV by heme (100 nM). All single-channel traces were included in the analysis. (C) Selected openings elicited by pulses to 200 mV in the control condition (left) and those by pulses to 240 mV with heme (100 nM; right). (D) Fractional numbers of blank sweeps observed at 170 mV without heme (left), at 170 mV with heme (100 nM; center), and at 240 mV with heme (100 nM; right). Pulses (≥50 ms at 170 mV and ≥40 ms at 240 mV) were applied every 2 s. The fractional numbers of blank sweeps were calculated from the first latency distributions corrected for the number of channels. A typical distribution contained ≥100 events.
Figure 6.
Figure 6.
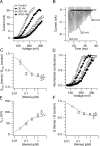
Concentration dependence of the inhibitory effect of heme. (A) Peak I–V curves obtained with different concentrations of heme in a representative patch. (B) Tail currents recorded at −40 mV saturate in size following pulses to 200 to 400 mV in 10 mV increments in the presence of 1 μM heme. The pulse to 200 mV was 50 ms in duration, and the duration decreased by 2 ms for each 10 mV increment so that the rightmost tail current was recorded following depolarization to 200 mV and the leftmost current was recorded following depolarization to 400 mV. (C) Changes in Gmax caused by different concentrations of heme. To limit prolonged extreme depolarization, the pulse duration decreased by 2 ms for every 10 mV depolarization starting from a 75 ms pulse to 0 mV. (C) Normalized macroscopic G–V curves obtained from the currents shown in A. The symbols are as in A. (D) Changes in V0.5 by different concentrations of heme. The mean V0.5 value in the control condition was 155 ± 2 mV. (E) Fractional changes in Qapp by different concentrations of heme. The mean Qapp value in the control condition was 1.2 ± 0.04 e. Smooth curves in B, C, and D reflect K d = 60 nM assuming a single binding site. n = 3–20.
Figure 7.
Figure 7.
Heme does not markedly alter Slo1 gating currents. (A) Representative gating currents elicited by depolarization from −80 mV to 200 mV before (thin) and after (thick sweep) heme (300 nM). Note that the stimulation duration used is too short to noticeably activate ionic currents. (B) QC–V is only slightly affected by heme. Smooth traces are fits to Boltzmann functions with voltage sensor charge zJ = 0.58 e (control, open symbol, QCV0.5 = 207.5 mV, QCmax = 13.4 nC; heme, filled symbol, QCV0.5 = 228.0 mV, QCmax = 12.8 nC). (C) Qc–V from B is plotted on a semilog scale to show that the limiting slope is not appreciably altered and is inconsistent with a 40% decrease in zJ to 0.35 (dashed trace) analogous to the 40% decrease in G–V slope produced by heme. (D) The slow component of IgOFF (dashed lines) following prolonged depolarization to +200 mV is reduced by heme, consistent with a marked decrease in open probability. Traces represent the average IgOFF following pulses of 5, 10, 15, and 20 ms duration. Individual records were indistinguishable for pulses of 5 ms or longer. A, B, C, and D were all from the same patch.
Figure 8.
Figure 8.
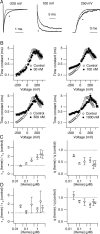
Changes in macroscopic Slo1 kinetics caused by heme. (A) Representative Slo1 currents at −220, 100, and 250 mV before and after heme application. In each set, the current recorded with heme (100 nM) is denoted by • (thick sweep). (B) Voltage dependence of the time constant of current relaxation at different concentrations of heme. Currents were fitted with single exponentials, and the time constant values are plotted as a function of voltage. (C) Concentration dependence of deactivation kinetics at ≤−100 mV. The estimated deactivation time constant values at ≤−100 mV were fitted with an exponential, and the extrapolated values at 0 mV (τ0) normalized to the control values are plotted as a function of heme concentration (left). The fractional changes in the equivalent charge (q) movement associated with the deactivation process are also shown (right). The mean values of τ0 and q in the control condition were 0.35 ± 0.017 ms and 0.14 ± 0.01 e. (D) Concentration dependence of activation kinetics at ≥210 mV. The estimated activation time constant values at ≥210 mV were fitted with an exponential and the extrapolated values at 0 mV (τ0) normalized to the respective control values are plotted as a function of the heme concentration (left). The fractional changes in the equivalent charge movement associated with the activation process are also shown (right). The mean values of τ0 and q in the control condition were 19.0 ± 3.8 ms and 0.24 ± 0.01 e. n = 3–21.
Figure 9.
Figure 9.
Heme increases the open probability at negative voltages. (A) Representative channel openings at −50, −100, and −150 mV in the control condition and after application of heme (100 nM). Downward deflections represent opening transitions. Heme decreased the current from the same patch at 160 mV (right). The current after heme application is indicated by • (thick sweep). This patch contained ∼150 channels assuming the open probability value of 0.5 at 160 mV and the unitary amplitude of 31 pA (see Fig. 3). (B) Voltage dependence of open probability. Open circles, control; filled circles, after heme (100 nM). Typically 60 s data were analyzed. n = 4–6 at each voltage. (C) Voltage dependence of mean open duration. The symbols are as in B. n = 4–6.
Figure 10.
Figure 10.
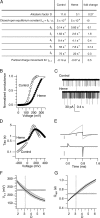
Simulation of the heme action in the absence of divalent ions using the HCA model. (A) The model parameters changed by heme application. The parameter values were adjusted to simulate the average results without heme and with heme (300 nM). As suggested by the results of the gating current measurements, the following parameters were kept constant: α = 1500 s−1, β = 35370 s−1, zα = 0.275 e, and zβ = −0.275 e. (B) G–V curves simulated by the model with the parameters shown in A. The values of V0.5 and Qapp for the simulated control and heme groups were 154 mV/1.3 e and 231 mV/0.71 e. (C) Simulated single-channel currents at −100 mV. The open probability values for the simulated control and heme groups were 1.6 × 10⁻⁵ and 1.5 × 10⁻⁴, and the mean dwell times were 0.24 and 0.45 ms, respectively. (D) Voltage dependence of the simulated macroscopic current relaxation. In A, B, and C, the currents were simulated assuming 250 channels. (E) Simulated ionic and gating currents elicited by depolarization to 200 mV from −100 mV. The top sweep shows ionic currents and the bottom sweep shows gating currents before and after (thick sweeps, denoted by •) heme application. Simulated assuming 20,000 channels. The scale bars represent 700 nA for the ionic currents and 100 pA for the gating currents. (F) Estimated V0.5 values as a function of D. The ionic currents were simulated and analyzed using different values of D and L0. The remaining parameter values are as in A. The thick curve describes how V0.5 changes with D using L0 = 5 × 10⁻⁴. The top thin curve describes V0.5 changes with L0 = 7 × 10⁻⁴ and the bottom thin curve describes those with L0 = 3 × 10⁻⁴. The area between the two thin curves is shaded gray. The dotted lines indicate the values of D and V0.5 as presented in A. The gray horizontal rectangle area represents the standard error associated with the experimentally estimated value of V0.5 with 300 nM heme. (G) Estimated Qapp values as a function of D. The thick curve describes how Qapp changes with D using L0 = 5 × 10⁻⁴. The top thin curve describes Qapp changes with L0 = 7 × 10⁻⁴, and the bottom thin curve describes those with L0 = 3 × 10⁻⁴. The dotted lines indicate the values of D and Qapp as presented in A. The gray horizontal rectangle area represents the standard error associated with the experimentally estimated value of Qapp with 300 nM heme.
Figure 11.
Figure 11.
Heme inhibits Slo1 currents in the presence of saturating levels of Ca2+ (120 μM) and Mg2+ (10 mM). (A) Representative currents at three different voltages before and after heme (100 nM) application with high Ca2+/Mg2+. In each set, the current recorded with heme (300 nM) is denoted by • (thick sweep). No leak or capacitative current subtraction. (B) Tail currents recorded at −160 mV saturate in size following pulses to −150 to 130 mV in 10 mV increments in the presence of 300 nM heme. The pulse to −150 mV was 75 ms in duration, and the duration decreased by 2 ms for each 10 mV increment. (C) Average G–V curves before (open symbols) and after (filled symbols) heme application (300 nM) with high Ca2+/Mg2+ (triangles) and with no Ca2+/Mg2+ (circles). Tail currents measured at −145 mV were used to estimate G–V with high Ca2+/Mg2+. The estimated values of V0.5 and Qapp in the control and heme groups with high Ca2+/Mg2+ were 80 ± 1.8 mV/1.1 ± 0.08 e and 49 ± 9.1 mV/0.64 ± 0.02 e, respectively. Without Ca2+/Mg2+, the parameter values were 160 ± 4.3 mV/1.2 ± 0.06 e and 229 ± 6.0 mV/0.72 ± 0.01 e, respectively. (D) Changes in normalized conductance caused by saturating levels of Ca2+ and Mg2+. Average normalized conductance values at 0 mV estimated with no Ca2+ and Mg2+ and with high [Ca2+] and [Mg2+] before and after heme application (300 nM) are compared. Error bars are smaller than the symbols. n = 5 to 8.
Figure 12.
Figure 12.
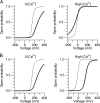
G–V curves simulated by the HA model. (A) Simulated G–V curves at 0 μM (left) and 100 μM Ca2+ (right) before (thin curves) and after (thick curves) heme application assuming that heme decreases D by 73% and increases L0 by a 10-fold as described in Fig. 10. (B) Simulated G–V curves assuming that heme decreases C, D, and E by 73% and increases L0 by 10-fold.
Figure 13.
Figure 13.
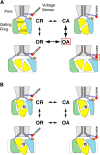
Model of heme action in the absence of Ca2+. Slo1 BK channels in various states of activation are represented by illustrations containing a pore domain whose S6 gate segments are connected by springs to both a charged S4 voltage sensor and a cytoplasmic gating ring. The pore undergoes a closed (C) to open (O) conformational change (vertical transitions) while the voltage sensor undergoes a resting (R) to activated (A) conformational change (horizontal transitions). Only portions of the channel's four subunits are shown, including a single voltage sensor. The states shown (CR, CA, OR, OA) correspond to a single cycle in the HCA model (Fig. 1). Channel opening is associated with expansion of the gating ring, composed of four RCK1/RCK2 dimers. (A) In the absence of heme, the gating ring structure and expansion with channel opening, involving rotation of RCK1/RCK2 dimers, is based on the model of Jiang et al. (2002) for MthK. The expanded gating ring and activated voltage sensor are shown to interact, thereby stabilizing the OA state. (B) Heme binding to the RCK1-RCK2 linker perturbs the RCK1/RCK2 dimer, altering gating ring diameter as compared with the control (dashed boxes) and inhibiting coupling between voltage sensor activation and channel opening by preventing the state-dependent interaction of voltage sensor and gating ring.

References

    1. Aihara, Y., B.S. Jahromi, R. Yassari, E. Nikitina, M. Agbaje-Williams, and R.L. Macdonald. 2004. Molecular profile of vascular ion channels after experimental subarachnoid hemorrhage. J. Cereb. Blood Flow Metab. 24:75–83. - PubMed
    1. Aldrich, R.W., D.P. Corey, and C.F. Stevens. 1983. A reinterpretation of mammalian sodium channel gating based on single channel recording. Nature. 306:436–441. - PubMed
    1. Armstrong, C.M. 2003. Voltage-gated K channels. Sci STKE. 2003:re10. - PubMed
    1. Avdonin, V., B. Nolan, J.M. Sabatier, M. De Waard, and T. Hoshi. 2000. Mechanisms of maurotoxin action on Shaker potassium channels. Biophys. J. 79:776–787. - PMC - PubMed
    1. Avdonin, V., X.D. Tang, and T. Hoshi. 2003. Stimulatory action of internal protons on Slo1 BK channels. Biophys. J. 84:2969–2980. - PMC - PubMed

Publication types

MeSH terms

Substances