

Overweight and obesity trends from 1974 to 2003 in English children: what is the role of socioeconomic factors?
- PMID: 15956046
- PMCID: PMC1720119
- DOI: 10.1136/adc.2004.068932
Overweight and obesity trends from 1974 to 2003 in English children: what is the role of socioeconomic factors?
Abstract
Aims: To examine the childhood overweight and obesity prevalence trends between 1974 and 2003 and to assess whether these trends relate to parental social class and household income.
Methods: A school based and a general population health survey: the National Study of Health and Growth in 1974, 1984, and 1994, and the Health Survey for England, yearly from 1996 to 2003. Participants were 14,587 white boys and 14,014 white girls aged 5-10 years. Overweight and obesity prevalence were calculated using UK specific as well as international body mass index (kg/m2) cut-offs. Socioeconomic status was measured using the Registrar General's social class; household income (1997 onwards only) was adjusted for household size.
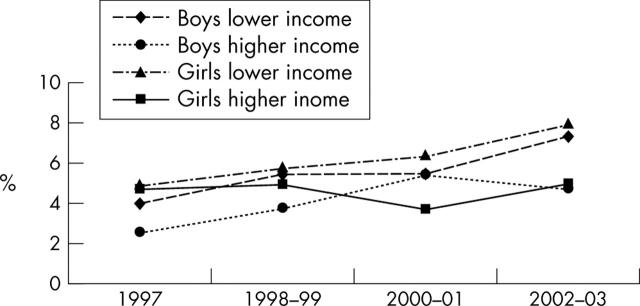
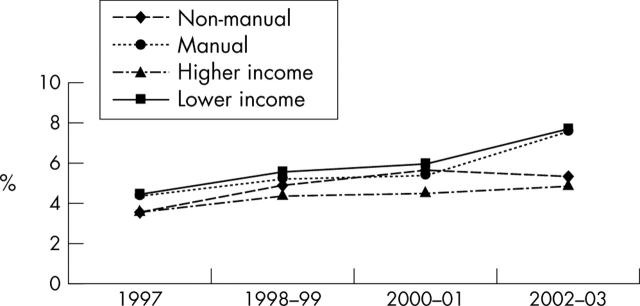
Results: The prevalence of obesity (UK specific definition) in boys increased from 1.2% in 1984 to 3.4% in 1996-97 and 6.0% in 2002-03. In girls, obesity increased from 1.8% in 1984 to 4.5% in 1996-97 and 6.6% in 2002-03. Obesity prevalence has been increasing at accelerating rates in the more recent years. Children from manual social classes had marginally higher odds (OR 1.14, 95% CI 0.98 to 1.33) and children from higher income households had lower odds (OR 0.74, 95% CI 0.61 to 0.89) to be obese than their peers from non-manual class, and lower income households, respectively.
Conclusion: Childhood obesity is increasing rapidly into the 2000s in England and these increases are more marked among children from lower socioeconomic strata. There is an urgent need for action to prevent further increase in obesity among children.
Figures
References
Publication types
MeSH terms
LinkOut - more resources
Full Text Sources
Medical