. 2005 Jun 28;102(26):9406-11.
doi: 10.1073/pnas.0501744102. Epub 2005 Jun 14.

Collecting duct-specific deletion of peroxisome proliferator-activated receptor gamma blocks thiazolidinedione-induced fluid retention

Affiliations

Collecting duct-specific deletion of peroxisome proliferator-activated receptor gamma blocks thiazolidinedione-induced fluid retention

Hui Zhang et al. Proc Natl Acad Sci U S A. .

Abstract

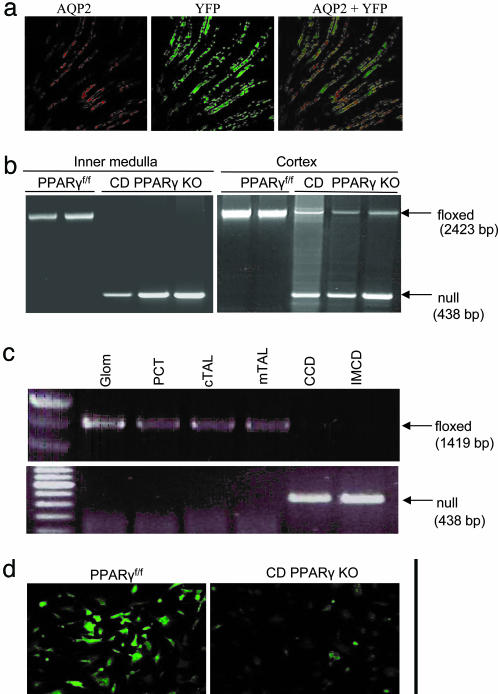
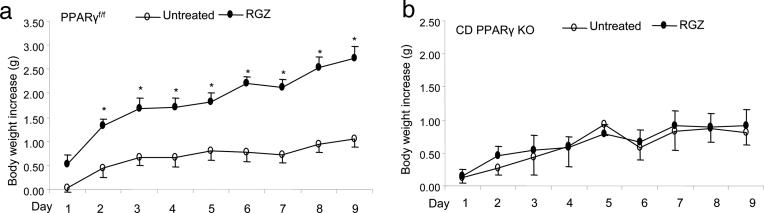
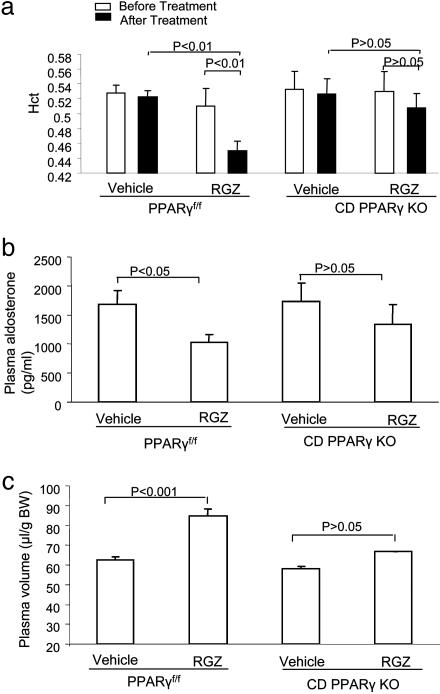
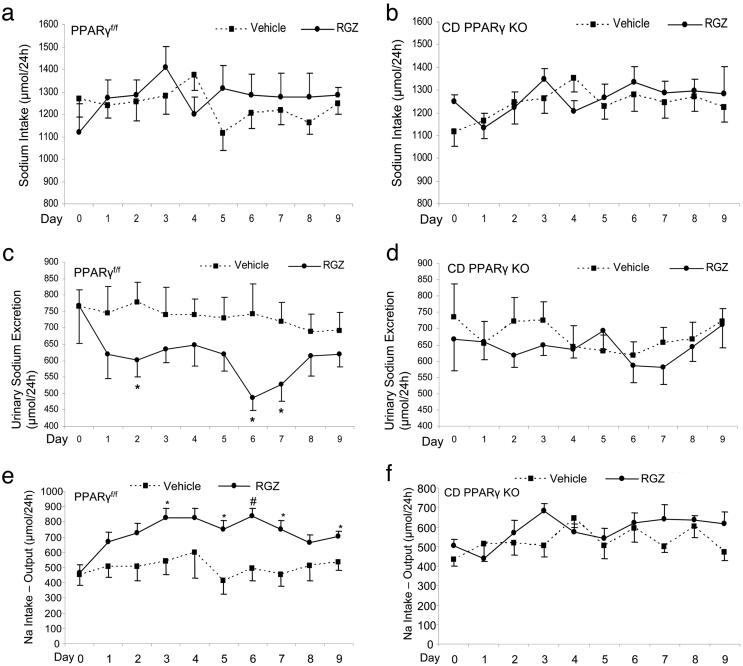
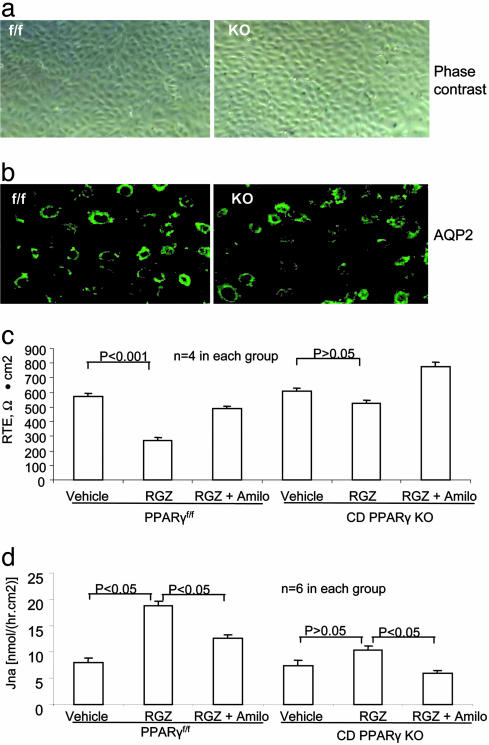
The peroxisome proliferator-activated receptor subtype gamma (PPARgamma) ligands, namely the synthetic insulin-sensitizing thiazolidinedione (TZD) compounds, have demonstrated great potential in the treatment of type II diabetes. However, their clinical applicability is limited by a common and serious side effect of edema. To address the mechanism of TZD-induced edema, we generated mice with collecting duct (CD)-specific disruption of the PPARgamma gene. We found that mice with CD knockout of this receptor were resistant to the rosiglitazone- (RGZ) induced increases in body weight and plasma volume expansion found in control mice expressing PPARgamma in the CD. RGZ reduced urinary sodium excretion in control and not in conditional knockout mice. Furthermore, RGZ stimulated sodium transport in primary cultures of CD cells expressing PPARgamma and not in cells lacking this receptor. These findings demonstrate a PPARgamma-dependent pathway in regulation of sodium transport in the CD that underlies TZD-induced fluid retention.


Figures

Fig. 1.
Fig. 1.
Validation of CD-specific KO of PPARγ. (a) Colocalization of YFP expression and AQP2 immunofluorescence in mice doubly heterozygous for ROSA26-YFP and AQP2-Cre. A representative photomicrograph is shown from three separate animals (×600). (b) PCR analysis of AQP2-Cre mediated recombination of the PPARγ gene in the inner medulla and cortex. Null band (438 bp) is the recombination product after deletion of exon 2 of the PPARγ. Exon 2 was nearly completely deleted in the inner medulla and partially deleted in the cortex of CD PPARγ KO mice (n = 3) as compared with the floxed controls (n = 2). (c) PCR analysis of AQP2-Cre-mediated recombination of the PPARγ gene in microdissected nephron segments from PPARγ KO mice. (d) Immunocytochemistry analysis of PPARγ protein expression in CD cells derived from PPARγ KO mice. CD cells were isolated by using lectin-coated dynabeads and grown in a chamber slide. Immunocytochemistry was performed by using a polyclonal antibody against PPARγ. Shown is a representative from three separate experiments.
Fig. 2.
Fig. 2.
Body-weight gains in untreated and RGZ-treated PPARγf/f mice (a) and CD PPARγ KO mice (b). PPARγf/f per vehicle, n = 11; PPARγf/f per RGZ, n = 9; CD PPARγ KO per vehicle, n = 8; CD PPARγ KO group, n = 9. *, P < 0.05 vs. vehicle at the corresponding time point.
Fig. 3.
Fig. 3.
Changes in plasma volume in PPARγf/f and CD PPARγ KO mice after RGZ treatment. (a) Hct in PPARγf/f and CD PPARγ KO mice before and after RGZ treatment. PPARγf/f per vehicle, n = 4; PPARγf/f per RGZ, n = 5; CD PPARγ KO per vehicle, n = 4; CD PPARγ KO group, n = 4. (b) Plasma aldosterone levels in PPARγf/f and CD PPARγ KO mice after RGZ treatment. n = 4 in each group. (c) Determination of plasma volume PPARγf/f and CD PPARγ KO mice by the Evans blue technique. PPARγf/f per vehicle, n = 5; PPARγf/f per RGZ, n = 6; CD PPARγ KO per vehicle, n = 4; CD PPARγ KO group, n = 4.
Fig. 4.
Fig. 4.
Comparison of urinary sodium excretion and sodium intake between PPRAγf/f and CD PPARγ KO mice. After a 7-day acclimation period, PPRAγf/f and CD PPARγ KO mice were treated for 9 days with the gelled diet incorporated with or without RGZ. Shown are daily sodium intake (a and b), urinary sodium excretion (c and d), and sodium balance (intake–output) (e and f). n = 9 in each group. *, P < 0.05 vs. vehicle; #, P < 0.001 vs. vehicle at the corresponding time point.
Fig. 5.
Fig. 5.
Comparison of sodium transport between the cultured CD cells derived from PPARγf/f and CD PPARγ KO mice. (a) Phase-contrast micrograph of confluent CD cells derived from PPARγf/f and CD PPARγ KO mice. (b) AQP2 immunocytochemistry showing AQP2 expression in the unstimulated control and CD PPARγ KO cells. (c) Changes of transepithelial resistance (RTE) in the control and CD PPARγ KO cells after RGZ treatment. (d) Changes in 22Na flux in the control and PPARγ KO cells after RGZ treatment.

References

    1. Cheng-Lai, A. & Levine, A. (2000) Heart Dis. 2, 326-333. - PubMed
    1. Parulkar, A. A., Pendergrass, M. L., Granda-Ayala, R., Lee, T. R. & Fonseca, V. A. (2001) Ann. Intern. Med. 134, 61-71. - PubMed
    1. Haffner, S. M., Greenberg, A. S., Weston, W. M., Chen, H., Williams, K. & Freed, M. I. (2002) Circulation 106, 679-684. - PubMed
    1. Hirsch, I. B., Kelly, J. & Cooper, S. (1999) Arch. Intern. Med. 159, 1811. - PubMed
    1. Fuchtenbusch, M., Standl, E. & Schatz, H. (2000) Exp. Clin. Endocrinol. Diabetes 108, 151-163. - PubMed

Publication types

MeSH terms