Comparative Study
. 2005 Jun 21;102(25):8949-54.
doi: 10.1073/pnas.0503259102. Epub 2005 Jun 13.

Phenotype-genotype correlation in Hirschsprung disease is illuminated by comparative analysis of the RET protein sequence

Affiliations
Comparative Study

Phenotype-genotype correlation in Hirschsprung disease is illuminated by comparative analysis of the RET protein sequence

Carl S Kashuk et al. Proc Natl Acad Sci U S A. .

Abstract

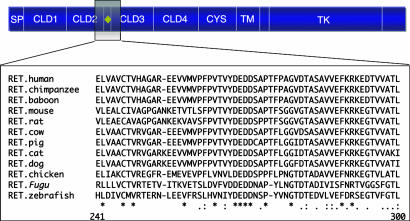
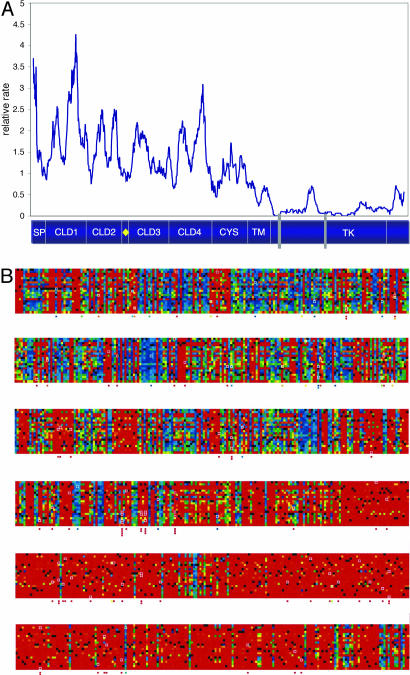
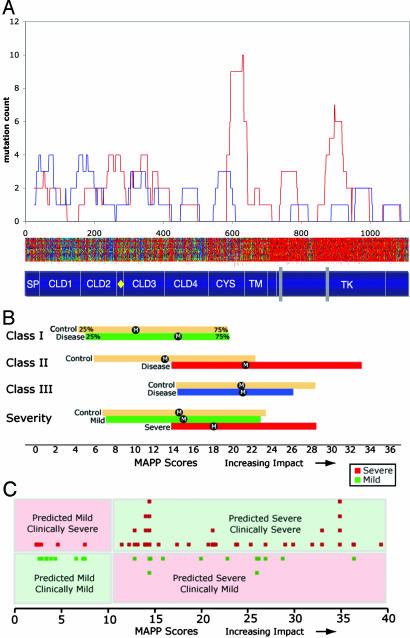
The ability to discriminate between deleterious and neutral amino acid substitutions in the genes of patients remains a significant challenge in human genetics. The increasing availability of genomic sequence data from multiple vertebrate species allows inclusion of sequence conservation and physicochemical properties of residues to be used for functional prediction. In this study, the RET receptor tyrosine kinase serves as a model disease gene in which a broad spectrum (> or = 116) of disease-associated mutations has been identified among patients with Hirschsprung disease and multiple endocrine neoplasia type 2. We report the alignment of the human RET protein sequence with the orthologous sequences of 12 non-human vertebrates (eight mammalian, one avian, and three teleost species), their comparative analysis, the evolutionary topology of the RET protein, and predicted tolerance for all published missense mutations. We show that, although evolutionary conservation alone provides significant information to predict the effect of a RET mutation, a model that combines comparative sequence data with analysis of physiochemical properties in a quantitative framework provides far greater accuracy. Although the ability to discern the impact of a mutation is imperfect, our analyses permit substantial discrimination between predicted functional classes of RET mutations and disease severity even for a multigenic disease such as Hirschsprung disease.


Figures

Fig. 1.
Fig. 1.
Eleven of 12 RET orthologs may be successfully aligned with the human reference RET protein. Schematic representation of RET protein functional domains and example of their amino acid multiple alignment (residues 237–296, inclusive). SP, signal peptide; yellow diamond, Ca2+-binding site; TM, transmembrane domain. The complete multiple alignment is provided in Supporting Text.
Fig. 2.
Fig. 2.
Comparative sequence analysis facilitates estimation of the relative rate of RET evolution. (A) Plot of the relative rate of RET evolution using the method of Stone and coworkers (5). Functional domains are annotated as in Fig. 1 with the addition of two gray rectangles corresponding to highly conserved protein kinase motifs (GEGEFGKV and HRDLAARN) at residues 731–738 and 872–879, respectively. (B) Heat plot of the RET protein. The RET protein is displayed in rows, each of 186 residues. The vertical axis of each row represents all 20 amino acids (a–y, top to bottom). Tolerance for any change from wild type to another residue is indicated by color (red, orange, yellow, green, and blue). Red, least most likely to be tolerated; blue, most likely to be tolerated; black, wild-type residue; white box, mutant residue (also shown below the corresponding position). B is enlarged in Supporting Text (See Fig. 6, which is published as supporting information on the PNAS web site).
Fig. 3.
Fig. 3.
MAPP score estimates identify phenotype:genotype correlations for RET. (A) Distributions of mutations associated with clinically severe (red, long-segment HSCR, MEN2, or copresentation of HSCR and MEN2) and less clinically severe (blue, short-segment HSCR). Also displayed are a schematic representation of RET protein functional domains (Fig. 2A) and a MAPP heat plot (Fig. 2B). (B) Distribution of RET variant MAPP scores corresponding to mutation class (Class, Top) and clinical severity (Severity, Bottom). The interquartile range (25–75%) of scores for each set is shown, with the median denoted by “M.” Interquartile ranges of control distributions are in tan. (C) Prediction of disease severity. Severe (red squares, Upper) and mild (green squares, Lower) variants are plotted against their MAPP scores. Correct predictions (Upper Right and Lower Left) are shown in relief on a green background; incorrect predictions (Upper Left and Lower Right) have a pink background.

References

    1. Dayhoff, M. O. (1979) Atlas of Protein Sequence and Structure (National Biomedical Research Foundation, Washington, DC), Vol. 5, Suppl. 3.
    1. Majewski, J. & Ott, J. (2003) Gene 305, 167–173. - PubMed
    1. Ng, P. C. & Henikoff, S. (2003) Nucleic Acids Res. 31, 3812–3814. - PMC - PubMed
    1. Grantham, R. (1974) Science 185, 862–864. - PubMed
    1. Simon, A. L., Stone, E. A. & Sidow, A. (2002) Proc. Natl. Acad. Sci. USA 99, 2912–2917. - PMC - PubMed

Publication types

Substances

LinkOut - more resources