. 2005 Aug;16(8):3908-18.
doi: 10.1091/mbc.e04-12-1063. Epub 2005 Jun 15.

Two human orthologues of Eco1/Ctf7 acetyltransferases are both required for proper sister-chromatid cohesion

Affiliations

Two human orthologues of Eco1/Ctf7 acetyltransferases are both required for proper sister-chromatid cohesion

Fajian Hou et al. Mol Biol Cell. 2005 Aug.

Abstract

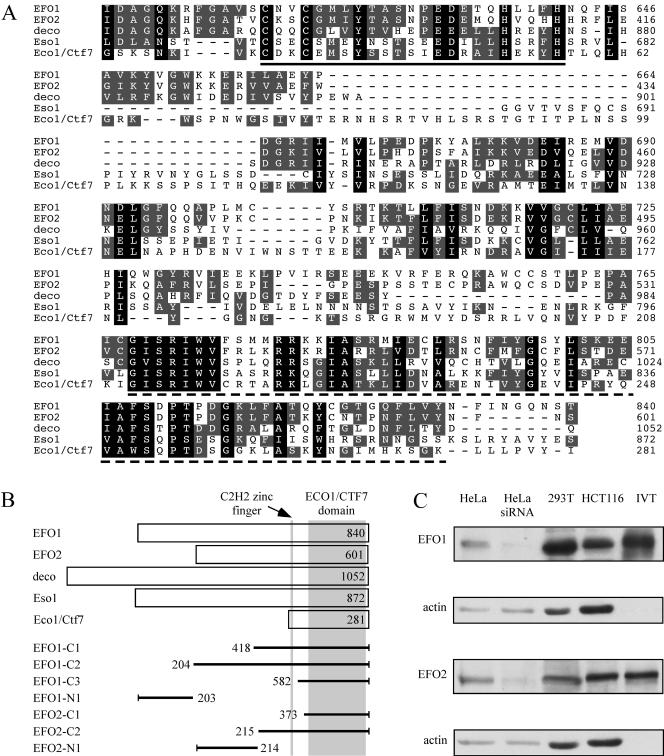
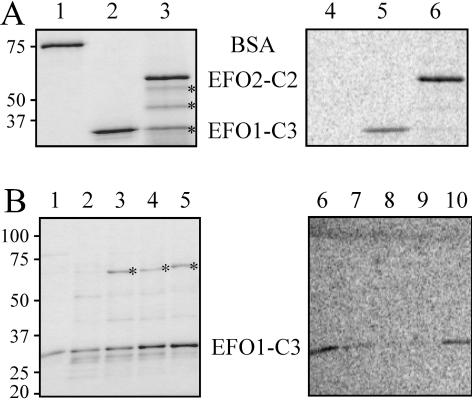
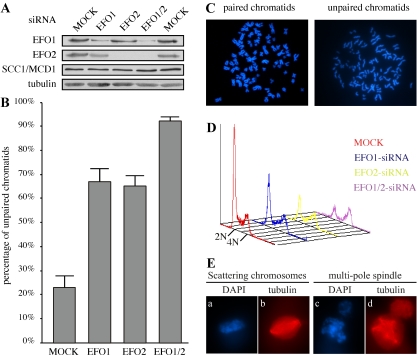
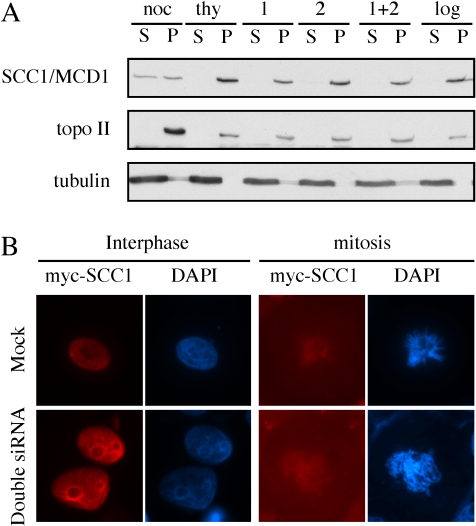
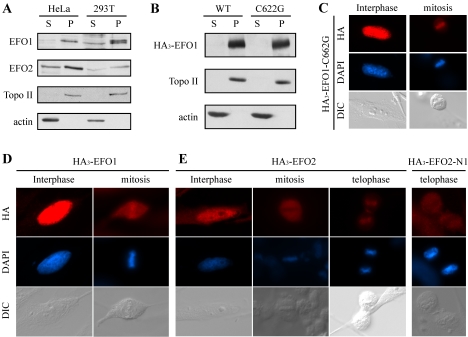
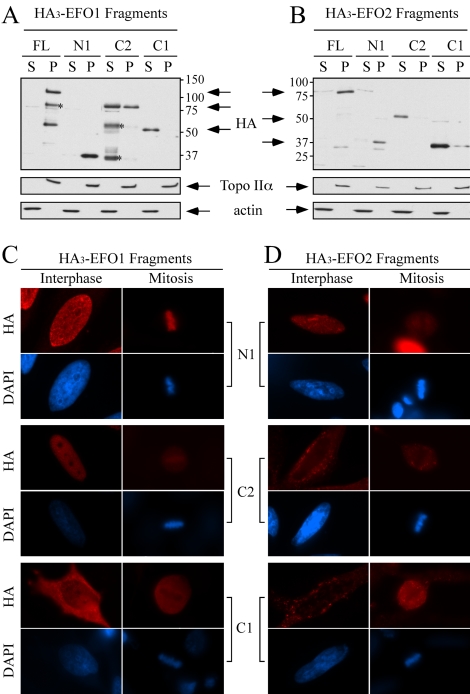
Genetic studies in yeast and Drosophila have uncovered a conserved acetyltransferase involved in sister-chromatid cohesion. Here, we described the two human orthologues, previously named EFO1/ESCO1 and EFO2/ESCO2. Similar to their yeast (Eco1/Ctf7 and Eso1) and fly (deco) counterparts, both proteins feature a conserved C-terminal domain consisting of a H2C2 zinc finger motif and an acetyltransferase domain that is able to catalyze autoacetylation reaction in vitro. However, no similarity can be detected outside of the conserved domain. RNA interference depletion experiment revealed that EFO1/ESCO1 and EFO2/ESCO2 were not redundant and that both were required for proper sister-chromatid cohesion. The difference between EFO1 and EFO2 also is reflected in their cell cycle regulation. In mitosis, EFO1 is phosphorylated, whereas EFO2 is degraded. Furthermore, both proteins associate with chromosomes, and the chromosome binding depends on the diverse N-terminal domains. We propose that EFO1 and EFO2 are targeted to different chromosome structures to help establish or maintain sister-chromatid cohesion.


Figures

Figure 1.
Figure 1.
Identification of human homologues of Eco1/Ctf7. (A) Sequence alignment of the conserved C-terminal region. The residues conserved among all five sequences are shaded with black, and the residues conserved among any three of the five are shaded in gray. The C2H2 zinc finger and the acetyltransferase domain is highlighted a solid and a dash line, respectively. (B) Organization of the five Eco1/Ctf7 family proteins. Conserved zinc finger and acetyltransferase domain are indicated in gray. The fragments of EFO1 and EFO2 used in this study also are presented in the diagram. (C) Western blot of endogenous EFO1 and EFO2 in HeLa, 293T, and HCT116 cells. Their migrations on SDS-PAGE were compared with the EFO1 and EFO2 protein transcribed and translated in wheat germ extract (IVT) using their cDNA. As negative controls, lysates of HeLa cells transfected with EFO1- or EFO2-siRNA oligonucleotides also were blotted. Neither EFO1 nor EFO2 was detected in the wheat germ extract in the absence of the plasmids (our unpublished data).
Figure 2.
Figure 2.
EFO1 and EFO2 catalyzed autoacetylation. (A) In vitro autoacetylation of EFO1 and EFO2. Purified recombinant EFO1-C3 (lanes 2 and 5) and EFO2-C2 (lanes 3 and 6) fragments were tested for their autoacetylation activity. BSA was used as the negative control (lanes 1 and 3). For each reaction, 0.5 μg of the recombinant protein was added. After reaction, the mixtures were analyzed on SDS-PAGE, and proteins were visualized by Coomassie Blue staining (left). The molecular weight markers (kilodaltons) are indicated on the left side of the gel. The asterisks indicate the degradation fragments of EFO2-C2. The same gel was dried and exposed to a phosphorimage screen to detect 14C labeling (right). (B) Mutations in the conserved acetyltransferase domain of EFO1 reduced the activity of autoacetylation. Various point mutations were introduced into the EFO1-C3 fragments within the conserved putative acetyltransferase domain. Recombinant proteins were then purified from E. coli, and their acetyltransferase activity was determined as described in A. The amount of protein in the assay was measured by Coomassie Blue staining (left). The same gel was exposed to phosphorimage screen (right). The activity of the G768D (lanes 2 and 7), R779/780G (lanes 3 and 8), and K782E/I783V (lanes 4 and 9) mutants was significantly reduced compared with that of the wild-type control (lanes 1 and 5). The E889G (lanes 5 and 10) mutation slightly reduced the amount of 14C labeling. The bands indicated by asterisks were likely a copurified heat-shock protein. The mutant proteins were less stable as their wild-type counterpart, indicated by the presence of the degradation fragments. The molecular weight (kilodaltons) of the size markers is indicated on the left.
Figure 3.
Figure 3.
Defective chromatid cohesion in HeLa cells depleted of EFO1 and/or EFO2. (A) The expression levels of SCC1/MCD1, EFO1, and EFO2 in HeLa cells depleted of EFO1 and/or EFO2. (B) Quantification of the percentage of the unpaired chromosomes in the metaphase spreads prepared from the aforementioned siRNA cells. The standard derivations were calculated based on at least four independent double-blinded experiments and plotted as the error bars. (C) Examples of the metaphase chromosome spreads. The spread of paired sister-chromatids were prepared from mock-transfected HeLa cells, and the spread of unpaired sister-chromatids were prepared from EFO1-siRNA cells. (D) FACS analysis of the siRNA cells described in Figure 2A. (E) Stacks of confocal images of mitotic cells with scattering chromosomes (a and b) and multipole spindles (c and d). The images were taken from double-depleted cells. Chromosomes (blue) were stained with DAPI, and spindles (red) were stained with a monoclonal antibody to α-tubulin.
Figure 4.
Figure 4.
Chromosome localization of SCC1/MCD1 in interphase cells was not affected by EFO1 and/or EFO2 depletion. (A) The same samples described in Figure 2A were fractionated into S and P fractions. As controls, thymidine-nocodazole arrested prometaphase cells (noc), double-thymidine arrested G1/S cells (thy), and log phase cells (log) were fractionated together with HeLa cells transfected with EFO1 (1), EFO2 (2), and EFO1 and 2 (1 + 2) siRNA oligonucleotides. The distribution of SCC1/MCD1 was analyzed. Topo IIα and α-tubulin, which localized to chromosomes and the cytoplasm, respectively, were used as controls for the cellular fractionation. (B) Immunofluorescence images of HeLa cells mock-treated or double-depleted of EFO1 and EFO2. Extraction with 0.1% Triton X was performed to remove soluble proteins. DNA (blue) was stained DAPI, and SCC1/MCD1-myc9 (red) was detected with a monoclonal anti-myc (9E10).
Figure 5.
Figure 5.
EFO1 and EFO2 localized to chromosomes. (A) The localization of the endogenous EFO1 and EFO2 in HeLa and 293T cells were analyzed by cellular fractionation. (B) HA3-tagged wild-type and C622G mutant EFO1 were expressed in 293T cells, and their localization was analyzed by cellular fractionation. The localization of HA3-EFO1-C622G (C), HA3-EFO1 (D), HA3-EFO2 (E), and HA3-EFO2-N1 (E) also was analyzed by immunofluorescence microscopy. HA-tagged EFO1 and EFO2 fragments (red) were detected with anti-HA, and DNA (blue) was detected with DAPI staining. Differential interference contrast (DIC) images also were presented. The seemingly midbody staining of HA3-EFO2-N1 was not consistently observed.
Figure 6.
Figure 6.
The N-terminal domains of EFO1 and EFO2 mediate their chromosome association. Various fragments of EFO1 (A) and EFO2 (B) were fused with HA3-tag and introduced into 293T cells. Their localizations were determined by cellular fractionation followed by Western blot with anti-HA antibody. The molecular weight (kilodaltons) of the size markers is indicated. The asterisks indicate the degradation fragments. The random weak signals in B are cross-reacting bands. The localization of the EFO1 (C) and EFO2 (D) fragments also was analyzed in HeLa cells by immunofluorescence microscopy.
Figure 7.
Figure 7.
Cell cycle regulation of EFO1 and EFO2. (A) Expression levels of EFO1 and EFO2 in cells released from double-thymidine arrest. (B) The expression level and cellular localization of EFO1 and EFO2 in cells released from nocodazole arrest. The time points were indicated above the panels. Phosphatase treatment indicated that the chromosomal EFO1 is specifically phosphorylated during mitosis. Securin and phospho-histone H3 were used as mitotic markers (see text). Topoisomerase IIα (Topo II) and α-actin are used as the marker for the P fractions and the S fractions, respectively.

Similar articles

Cited by

References

    1. Bellows, A. M., Kenna, M. A., Cassimeris, L., and Skibbens, R. V. (2003). Human EFO1p exhibits acetyltransferase activity and is a unique combination of linker histone and Ctf7p/Eco1p chromatid cohesion establishment domains. Nucleic Acids Res. 31, 6334-6343. - PMC - PubMed
    1. Brands, A., and Skibbens, R. V. (2005). Ctf7p/Eco1p exhibits acetyltransferase activity–but does it matter? Curr. Biol. 15, R50-R51. - PubMed
    1. Ciosk, R., Shirayama, M., Shevchenko, A., Tanaka, T., Toth, A., and Nasmyth, K. (2000). Cohesin's binding to chromosomes depends on a separate complex consisting of Scc2 and Scc4 proteins. Mol. Cell 5, 243-254. - PubMed
    1. Edwards, S., Li, C. M., Levy, D. L., Brown, J., Snow, P. M., and Campbell, J. L. (2003). Saccharomyces cerevisiae DNA polymerase epsilon and polymerase sigma interact physically and functionally, suggesting a role for polymerase epsilon in sister chromatid cohesion. Mol. Cell. Biol. 23, 2733-2748. - PMC - PubMed
    1. Fang, G., Yu, H., and Kirschner, M. W. (1998). Direct binding of CDC20 protein family members activates the anaphase-promoting complex in mitosis and G1. Mol. Cell 2, 163-171. - PubMed

Publication types

MeSH terms