. 2005 Jun 15;25(24):5691-9.
doi: 10.1523/JNEUROSCI.1030-05.2005.

Nucleokinesis in tangentially migrating neurons comprises two alternating phases: forward migration of the Golgi/centrosome associated with centrosome splitting and myosin contraction at the rear

Affiliations

Nucleokinesis in tangentially migrating neurons comprises two alternating phases: forward migration of the Golgi/centrosome associated with centrosome splitting and myosin contraction at the rear

Arnaud Bellion et al. J Neurosci. .

Abstract

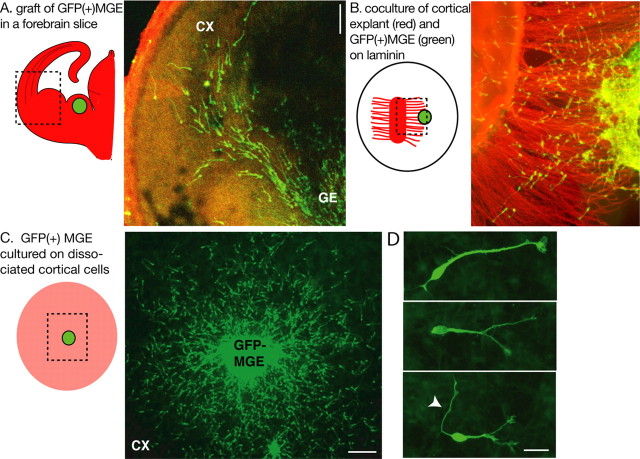
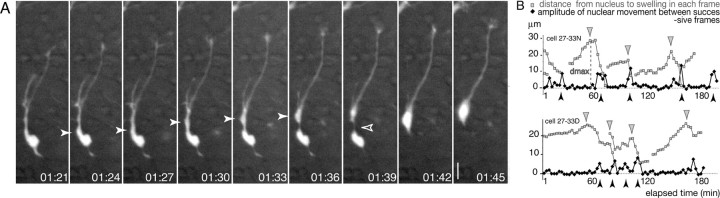
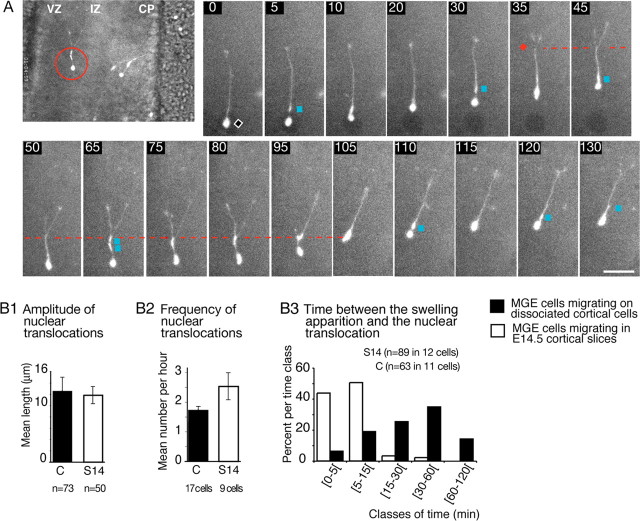
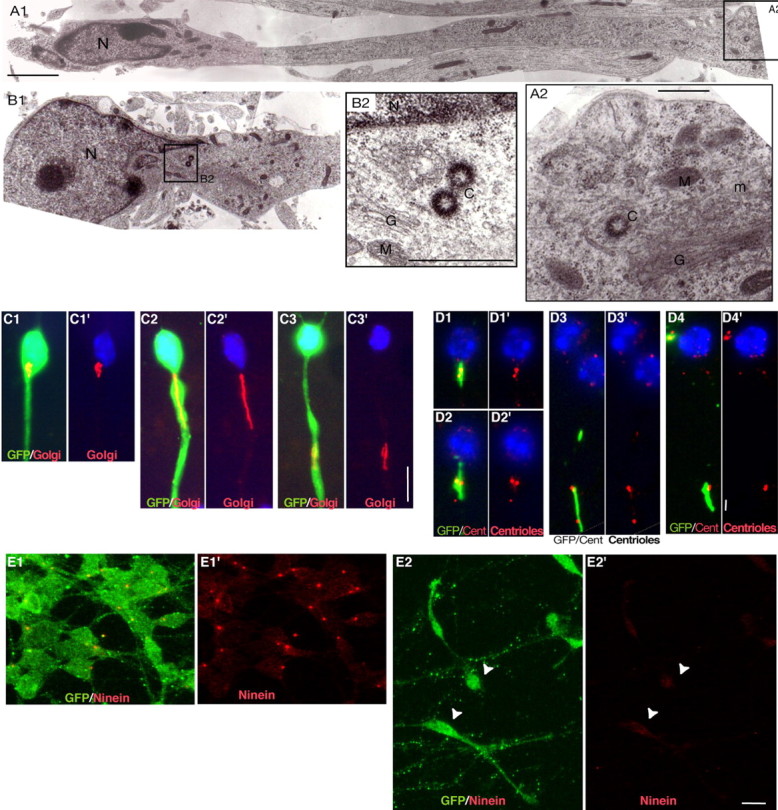
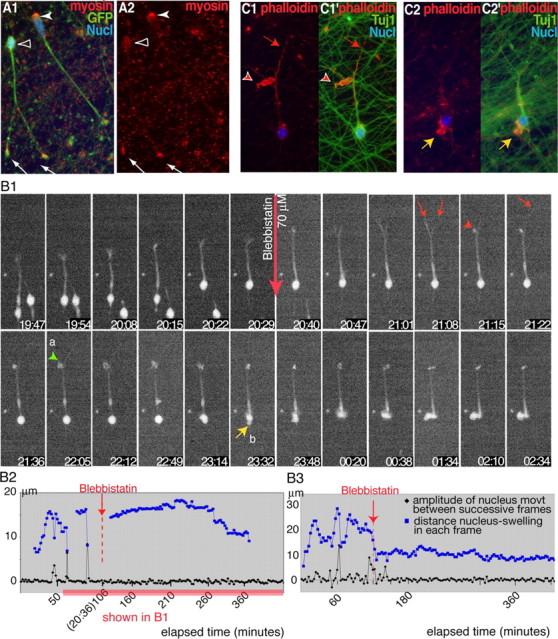
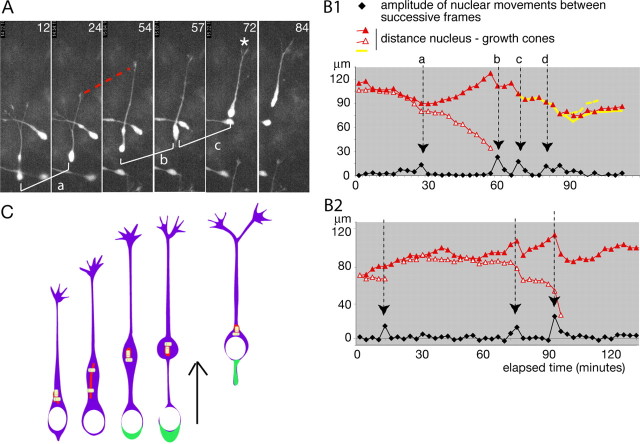
During rodent cortex development, cells born in the medial ganglionic eminence (MGE) of the basal telencephalon reach the embryonic cortex by tangential migration and differentiate as interneurons. Migrating MGE cells exhibit a saltatory progression of the nucleus and continuously extend and retract branches in their neuritic arbor. We have analyzed the migration cycle of these neurons using in vitro models. We show that the nucleokinesis in MGE cells comprises two phases. First, cytoplasmic organelles migrate forward, and second, the nucleus translocates toward these organelles. During the first phase, a large swelling that contains the centrosome and the Golgi apparatus separates from the perinuclear compartment and moves rostrally into the leading neurite, up to 30 mum from the waiting nucleus. This long-distance migration is associated with a splitting of the centrioles that line up along a linear Golgi apparatus. It is followed by the second, dynamic phase of nuclear translocation toward the displaced centrosome and Golgi apparatus. The forward movement of the nucleus is blocked by blebbistatin, a specific inhibitor of nonmuscle myosin II. Because myosin II accumulates at the rear of migrating MGE cells, actomyosin contraction likely plays a prominent role to drive forward translocations of the nucleus toward the centrosome. During this phase of nuclear translocation, the leading growth cone either stops migrating or divides, showing a tight correlation between leading edge movements and nuclear movements.


Figures

Figure 1.
Figure 1.
Experimental models to study the migratory behavior of MGE cells. A, To image MGE cells migrating in cortical slices, MGE explants dissected from GFP-expressing embryos were grafted homotopically in wild-type forebrain slices. The experimental model is schematized on the left. The green dot represents the GFP-expressing MGE explant. The dotted frame indicates the limits of the picture shown on the right. B and C illustrate the two coculture models used in the present study. B, GFP-expressing MGE explants were placed at the tip of cortical axons growing on a polylysine/laminin-coated substrate. In the scheme on the left, the MGE explant is a green dot; cortical explant and cortical axons are shown in red. MGE cells migrate on cortical axons. C, GFP-expressing MGE explants were placed on a monolayer of wild-type dissociated cortical cells (in pink in the scheme on the left). MGE cells migrate randomly on cortical cells. D, MGE cells migrating on cortical cells show bifurcated or branched leading processes. In some cases, a long thin neurite is observed at the trailing side (white arrowhead). GFP-positive MGE cells were immunostained using a green fluorescent secondary antibody (A-D). Cortical axons were immunostained with TUJ1 antibodies using a red fluorescent secondary antibody (B). CX, Cortex; GE, ganglionic eminence. Scale bars: A, C, 100 μm; D, 20 μm.
Figure 2.
Figure 2.
In cocultures, nuclear translocation is preceded by forward migration of perinuclear organelles. A, Time-lapse sequence of a GFP-expressing MGE cell migrating on wild-type dissociated cortical cells and imaged each 3 min using a 20× objective. Before the nuclear translocation (frames 01:39, 01:42), perinuclear material (white arrowhead) moves rostrally in the leading neurite and individualizes from the perinuclear compartment to which it remains linked by a thin bridge (open arrowhead). Elapsed time is indicated in hours and minutes on each frame. Scale bar, 10 μm. B, Graphs correlate the distance between the nucleus and rostral swelling (gray curves) with the successive nuclear displacements (black curves) in two cells. Nuclear translocations are represented as peaks in the black curve (black arrowheads). During waiting phases of the nucleus, the swelling moves away from the nucleus (ascending gray curve) until reaching a maximum distance (dmax; gray arrowheads). In the cell illustrated in the bottom graph, the nucleus reached the rostral swelling in two jumps.
Figure 3.
Figure 3.
MGE cells migrate faster in forebrain slices and show the same cycle of migration as on dissociated cortical cells. A, Time-lapse sequence shows the migration of a GFP-expressing MGE cell in an E14. 5 cortical slice. In a magnified view of the imaged slice (large picture on the left), the red circle locates the cell at the limit between the ventricular zone (VZ) and the intermediate zone (IZ). As in cocultures (Fig. 2), the nuclear migration is saltatory, and nuclear translocations end near swellings (blue squares) that form during waiting periods of the nucleus (black diamond). The leading growth cone division (red diamond) is correlated with a nuclear translocation (frames 30-35) and produces a bifurcation at the leading edge. One of the two paired branches collapses and retracts. Scale bar, 20 μm. CP, Cortical plate. B1-B3, Histograms show for MGE cells migrating on dissociated cortical cells (C; black bars) and for MGE cells migrating in E14.5 cortical slices (S14; white bars) that (1) the amplitude of nuclear translocations (B1) is the same, (2) the frequency of nuclear translocations (B2) is significantly increased in slices, and (3) swellings are observed for longer periods before nuclear translocation (B3) in cocultures (15-60 min) than in slices (<15 min). Error bars represent SE.
Figure 4.
Figure 4.
Localization and morphology of the centrosome and Golgi apparatus in MGE cells migrating on cortical cells. A1-B2, Ultrastructural analysis of MGE cells migrating on cortical axons reveals the presence of the centriole(s) and Golgi apparatus in a swelling of the leading process that can be located distant from (15 μm; A1) or close to (B1) the nucleus. The nucleus (N) occupies one pole of the cell and shows an indentation oriented toward the leading process (Gregory et al., 1988). Swellings contain one or two centrioles (C), depending on the plane of section (A2, B2). Centrioles were always located near the Golgi apparatus (G). M, Mitochondria; ER, rough endoplasmic reticulum; m, microtubules. Scale bars: A1, 2 μm; A2, 500 nm; B2, 200 nm. C1-C3′, Immunostainings of GFP (green; C1-C3) and the medial compartment of the Golgi apparatus (CTR433 in red) in migrating MGE cells. Nuclei are labeled with bis-benzimide (blue). The Golgi apparatus is located either close to the nucleus (C1′) or rostrally in a swelling of the neuritic trunk (C2′, C3′). It shows a compact (C1′, C3′) or a linear (C2′) conformation. Scale bar, 10 μm. D1-D4′, Immunostainings of the Golgi apparatus (CTR433 in green; D1-D4) and centrioles [centrin-2 (Cent) in red]. The two centrioles are associated with the Golgi apparatus (GA). In cells with a compact GA, the two centrioles appear as two close dots (D1′, D2′) or a single larger dot (D4′). In cells with a linear GA, the two centrioles are widely separated and line up along the GA (D3′). Scale bar, 2 μm. E1-E2′, In GFP-positive MGE cells aggregated on laminin (E1, E1′; GFP in green), ninein antibodies (red) strongly label a single dot in the centrosome. In MGE cells migrating on cortical axons (E2, E2′; GFP in green), the ninein-positive dot is no longer visible, whereas a faint labeling of the whole soma can be observed (E2′; white arrowheads). Scale bar, 10 μm.
Figure 5.
Figure 5.
Blebbistatin, a nonmuscle myosin II inhibitor, inhibits nuclear movement in MGE cells. A1, A2, In GFP-positive MGE cells (A1; green) migrating on cortical axons, myosin II detected by CC212 antibodies (red) either concentrates at the rear of the nucleus (white arrowhead) or is distributed over the whole cell body (open arrowhead). Myosin II also accumulates in growth cones (white arrows). B1-B3, Time-lapse sequence (B1) shows the response of an MGE cell migrating on cortical axons to blebbistatin 70 μm (red arrow). Time is indicated in hours and minutes on each frame. A graphic representation of the nuclear and swelling movements is shown in B2 (same legend as Fig. 2 B). B3 illustrates similar movements in another treated MGE cell. Nuclear translocations occur during the control period (frames 19:54 and 20:22 in B1, peaks of the black curves in B2 and B3) and are no longer observed after drug treatment. Blebbistatin stabilizes the swelling (blue curve) ahead of the nucleus. In B1, 45 min after drug application, one of the two leading neurites retracts and forms a large protrusion (red arrowhead; frame 21:15), whereas the other neurite extends (red arrow; frame 21:22). Protrusions develop at the neuritic bifurcation (green arrowhead; a) and around the nucleus (yellow arrow; b). At the end of the sequence, the nucleus enters a lateral protrusion (frame 01:34). C1-C2′, MGE cells migrating on cortical axons and treated with blebbistatin for 6 h were stained with phalloidin (red) and TUJ1 antibodies (green; C1, C2). F-actin accumulates into large protrusions at previous branching points (red arrowhead; the red arrow shows the leading neurite) and in the perinuclear compartment (yellow arrow). Nucl, Nucleus.
Figure 6.
Figure 6.
Neuritic elongation and nuclear migration are correlated in MGE cells. A, Frames of the time-lapse sequence depicted in B1. A GFP-expressing MGE cell migrating on wild-type dissociated cortical cells was imaged each for 3 min using a 40× objective. Elapsed time is indicated in minutes on each frame. Three nuclear translocations (a,b,c) are illustrated. Between translocations a and b, the leading process elongates (red dotted curve). A growth cone splitting (white asterisk) is visible at the end of translocation c. B1, B2, Graphs depict the sequence of migration of two MGE cells. Graph B1 corresponds to the cell illustrated in A. The black curve shows the amplitude of nuclear displacements between successive frames. Peaks in the curve (black arrows) identify translocation phases (same letters in A and B1). Colored curves represent the distance from the rostral edge of the nucleus to growth cones on each frame (leading growth cone in red). Between two nuclear translocations (black arrows), the leading neurite elongates, and the red curve hence ascends. Nuclear translocations are associated with an arrest of neuritic elongation and a shrinkage of the leading neurite. C, Schematic representation of nucleokinesis in MGE cells. During the resting phase of the nucleus (white), the centrioles (yellow) and Golgi apparatus (red) migrate forward, and the leading neurite elongates. The centrioles split, and the Golgi apparatus elongates. Then, myosin II accumulates at the rear of the cell body (green) and pushes the nucleus toward the centrosome/Golgi apparatus.

References

    1. Abal M, Piel M, Bouckson-Castaing V, Mogensen M, Sibarita JB, Bornens M (2002) Microtubule release from the centrosome in migrating cells. J Cell Biol 159: 731-737. - PMC - PubMed
    1. Anderson SA, Eisenstat DD, Shi L, Rubenstein JL (1997) Interneuron migration from basal forebrain to neocortex: dependence on Dlx genes. Science 278: 474-476. - PubMed
    1. Ang Jr ES, Haydar TF, Gluncic V, Rakic P (2003) Four-dimensional migratory coordinates of GABAergic interneurons in the developing mouse cortex. J Neurosci 23: 5805-5815. - PMC - PubMed
    1. Behar TN, Li YX, Tran HT, Ma W, Dunlap V, Scott C, Barker JL (1996) GABA stimulates chemotaxis and chemokinesis of embryonic cortical neurons via calcium-dependent mechanisms. J Neurosci 16: 1808-1818. - PMC - PubMed
    1. Bellion A, Métin C (2005) Early regionalisation of the neocortex and the medial ganglionic eminence. Brain Res Bull, in press. - PubMed

Publication types