. 2005 Jun 15;25(24):5720-9.
doi: 10.1523/JNEUROSCI.4935-04.2005.

Functional magnetic resonance imaging activity during the gradual acquisition and expression of paired-associate memory

Affiliations

Functional magnetic resonance imaging activity during the gradual acquisition and expression of paired-associate memory

Jon R Law et al. J Neurosci. .

Abstract

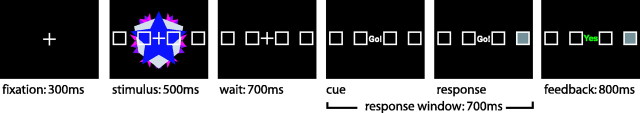
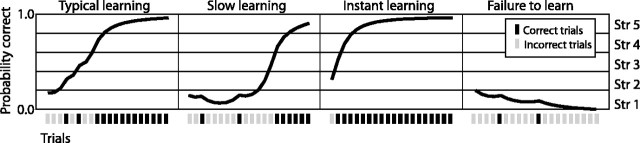
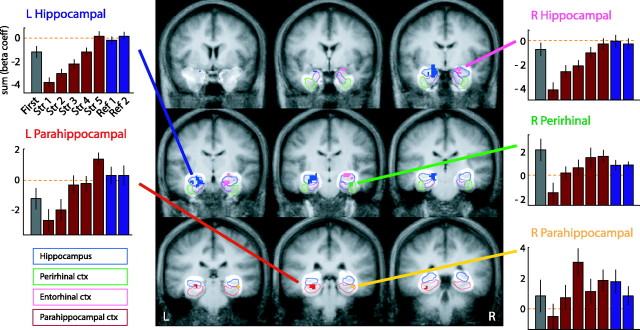
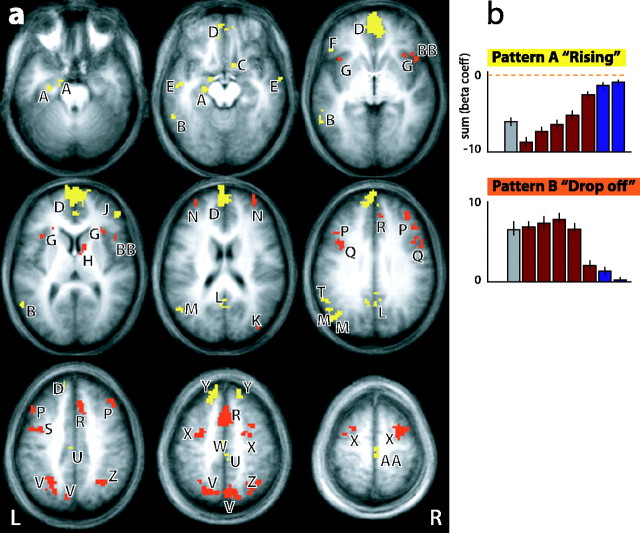
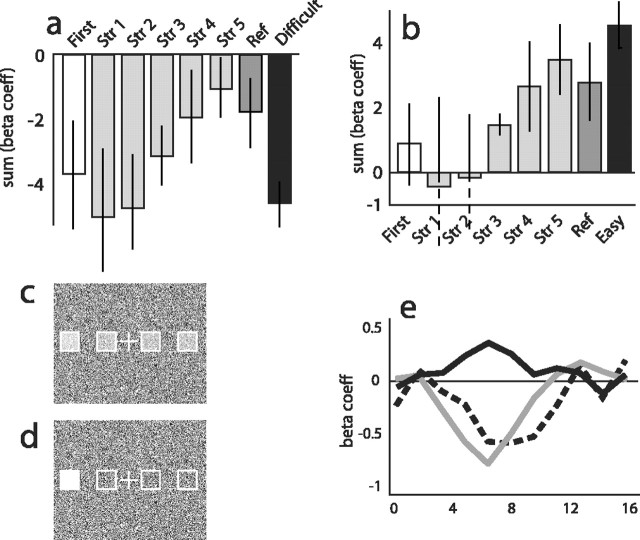
Recent neurophysiological findings from the monkey hippocampus showed dramatic changes in the firing rate of individual hippocampal cells as a function of learning new associations. To extend these findings to humans, we used blood oxygenation level-dependent (BOLD) functional magnetic resonance imaging (fMRI) to examine the patterns of brain activity during learning of an analogous associative task. We observed bilateral, monotonic increases in activity during learning not only in the hippocampus but also in the parahippocampal and right perirhinal cortices. In addition, activity related to simple novelty signals was observed throughout the medial temporal lobe (MTL) memory system and in several frontal regions. A contrasting pattern was observed in a frontoparietal network in which a high level of activity was sustained until the association was well learned, at which point the activity decreased to baseline. Thus, we found that associative learning in humans is accompanied by striking increases in BOLD fMRI activity throughout the MTL as well as in the cingulate cortex and frontal lobe, consistent with neurophysiological findings in the monkey hippocampus. The finding that both the hippocampus and surrounding MTL cortex exhibited similar associative learning and novelty signals argues strongly against the view that there is a clear division of labor in the MTL in which the hippocampus is essential for forming associations and the cortex is involved in novelty detection. A second experiment addressed a striking aspect of the data from the first experiment by demonstrating a substantial effect of baseline task difficulty on MTL activity capable of rendering mnemonic activity as either "positive" or "negative."


Figures

Figure 1.
Figure 1.
Sample stimulus and schematic diagram of trial structure.
Figure 2.
Figure 2.
Sample learning curves demonstrating the binning paradigm for five memory strengths (Str). Four archetypical curves resulting from the application of the logistic regression algorithm to sample data (Smith et al., 2004) are shown. At each stimulus trial, the algorithm generates a probability that the next trial will result in a correct response. Gray bars indicate incorrect trials, and black bars indicate correct trials. Each trial was subsequently binned into one of five memory strengths, each one comprising a cumulative degree of 0.2 probability.
Figure 3.
Figure 3.
MTL analysis identifying ROIs in which activity during acquisition varied across memory strength indices 1, 3, and 5, constrained by individual structure boundaries. There is a 5 mm gap between each coronal slice; the first panel is approximately +3 mm in Talairach space, and the last panel is approximately -37 mm in Talairach space. L, Left; R, right; Str, strength; Ref, reference; ctx, cortex; blue, left hippocampal ROI; pink, right hippocampal ROI; green, right perirhinal ROI; red, left parahippocampal ROI; yellow, right parahippocampal ROI. The highlighted areas indicate the boundaries of valid data after alignment with the ROI-AL technique. The colored outlines show the boundaries of individual MTL structures taken from the model to which all participants' MTLs were aligned (see legend). The bar graphs show the average activity for each of the functionally defined ROIs (all voxels within each ROI) as a function of trial type [gray, first exposure to each stimulus; red, memory strength indices 1-5; blue, reference images from the first (left) and second (right) half of each run]. Activity was quantified for each stimulus type using the raw values from the general linear model estimate (β coefficients) of the activity summed over the ∼3-12 s after stimulus onset. The dashed orange line indicates the putative zero as recorded in the baseline task; the abscissas shown are chosen for illustrative purposes.
Figure 4.
Figure 4.
a, Whole-brain analysis indicating regions in which activity varied during acquisition across memory strength indices 1, 3, and 5. There is a 10 mm gap between each axial slice. The color indicates which pattern of activity was observed in each region. b, All regions showed one of two discrete patterns of activation. Pattern A, Rising pattern (yellow); pattern B, drop-off pattern (orange). The coordinates (in Talairach space) and maximum β coefficient observed per ROI are shown in Table 2.
Figure 5.
Figure 5.
Activity in the left hippocampal region (voxels selected from experiment 1) in experiment 2 as a function of baseline difficulty. a, Activity for all trial types relative to the easy baseline (white, first presentation; light gray, strength indices 1-5 trials; dark gray, reference trials; black, difficult baseline trials). b, Activity for all trial types relative to the difficult baseline. In both, activity was quantified for each stimulus type using the raw values from the general linear model estimate (β coefficients) of the activity summed over the ∼3-12 s after stimulus onset. c, d, Sample difficult (c) and easy (d) baseline trials. e, Hemodynamic response for the middle memory strength index (strength 3) trials from experiment 2 relative to the easy baseline (gray line), experiment 2 relative to the difficult baseline (black line), and experiment 1 relative to its easy baseline (dashed line). Individual β coefficients are plotted at each time point. Str, Strength; Ref, reference.

References

    1. Aggleton JP, Brown MW (1999) Episodic memory, amnesia, and the hippocampal-thalamic axis. Behav Brain Sci 22: 425-444. - PubMed
    1. Brown MW, Aggleton JP (2001) Recognition memory: what are the roles of the perirhinal cortex and hippocampus? Nat Rev Neurosci 2: 51-61. - PubMed
    1. Cabeza R, Nyberg L (2000) Imaging cognition II: an empirical review of 275 PET and fMRI studies. J Cogn Neurosci 12: 1-47. - PubMed
    1. Caesar K, Gold L, Lauritzen M (2003a) Context sensitivity of activity-dependent increases in cerebral blood flow. Proc Natl Acad Sci USA 100: 4239-4244. - PMC - PubMed
    1. Caesar K, Thomsen K, Lauritzen M (2003b) Dissociation of spikes, synaptic activity, and activity-dependent increments in rat cerebellar blood flow by tonic synaptic inhibition. Proc Natl Acad Sci USA 100: 16000-16005. - PMC - PubMed

Publication types