. 2005;6(6):R49.
doi: 10.1186/gb-2005-6-6-r49. Epub 2005 May 17.

Large-scale 13C-flux analysis reveals mechanistic principles of metabolic network robustness to null mutations in yeast

Affiliations

Large-scale 13C-flux analysis reveals mechanistic principles of metabolic network robustness to null mutations in yeast

Lars M Blank et al. Genome Biol. 2005.

Abstract

Background: Quantification of intracellular metabolite fluxes by 13C-tracer experiments is maturing into a routine higher-throughput analysis. The question now arises as to which mutants should be analyzed. Here we identify key experiments in a systems biology approach with a genome-scale model of Saccharomyces cerevisiae metabolism, thereby reducing the workload for experimental network analyses and functional genomics.

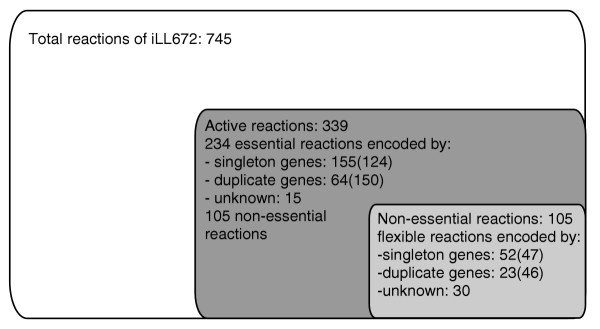
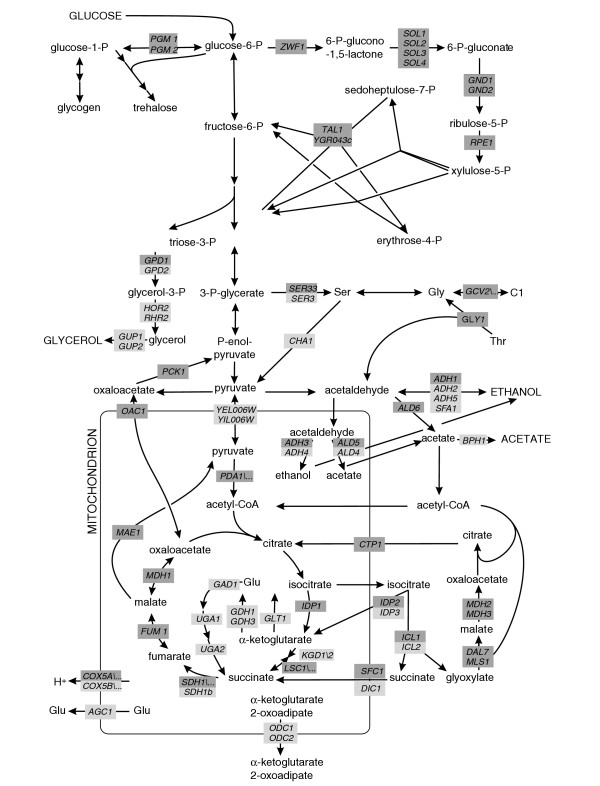
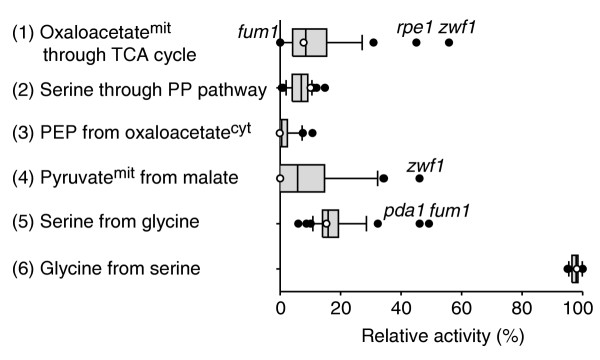
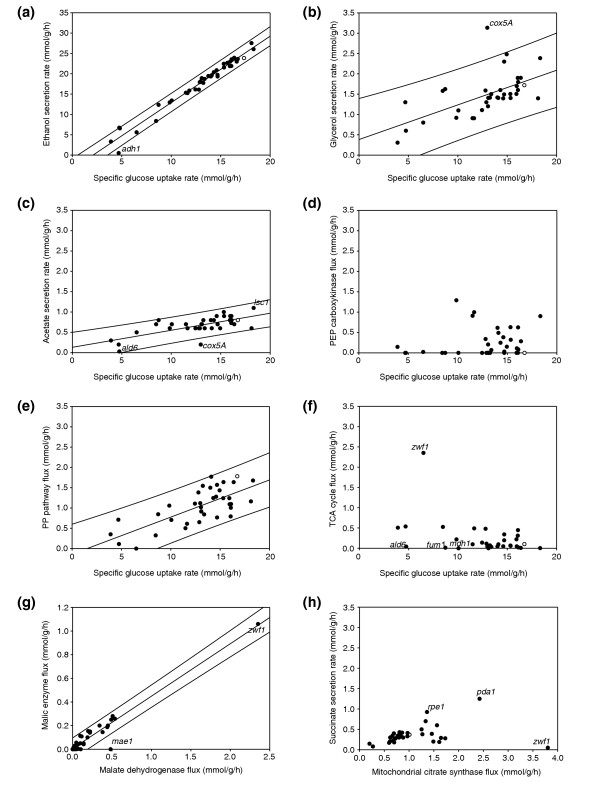
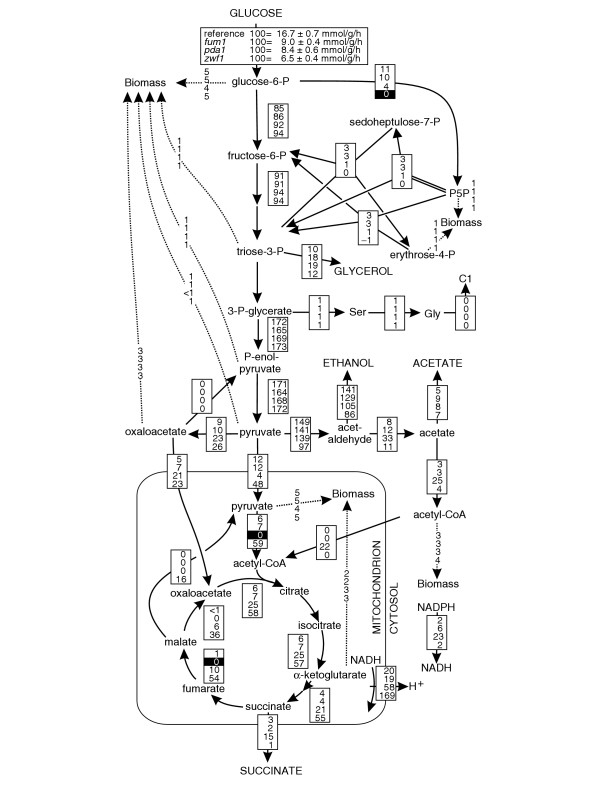
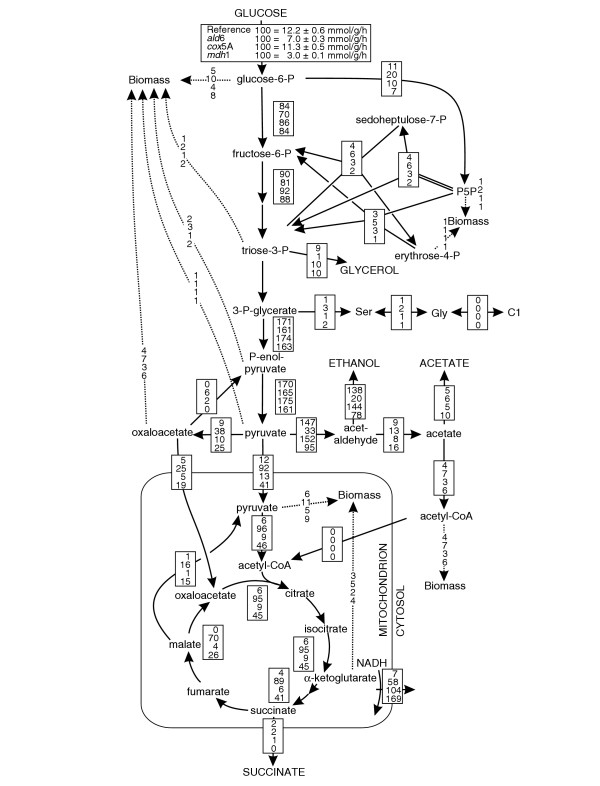
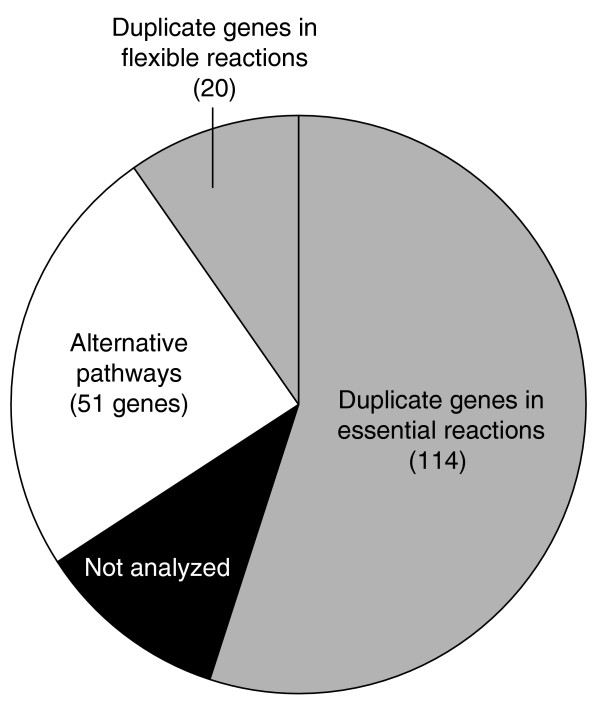
Results: Genome-scale 13C flux analysis revealed that about half of the 745 biochemical reactions were active during growth on glucose, but that alternative pathways exist for only 51 gene-encoded reactions with significant flux. These flexible reactions identified in silico are key targets for experimental flux analysis, and we present the first large-scale metabolic flux data for yeast, covering half of these mutants during growth on glucose. The metabolic lesions were often counteracted by flux rerouting, but knockout of cofactor-dependent reactions, as in the adh1, ald6, cox5A, fum1, mdh1, pda1, and zwf1 mutations, caused flux responses in more distant parts of the network. By integrating computational analyses, flux data, and physiological phenotypes of all mutants in active reactions, we quantified the relative importance of 'genetic buffering' through alternative pathways and network redundancy through duplicate genes for genetic robustness of the network.

Conclusions: The apparent dispensability of knockout mutants with metabolic function is explained by gene inactivity under a particular condition in about half of the cases. For the remaining 207 viable mutants of active reactions, network redundancy through duplicate genes was the major (75%) and alternative pathways the minor (25%) molecular mechanism of genetic network robustness in S. cerevisiae.


Figures

Figure 1
Figure 1
Genome-wide proportion of active, essential and flexible metabolic reactions during growth of S. cerevisiae (iLL672) on glucose. Flexible reactions are defined as having a non-zero flux but are not essential for growth. The number of genes that encode biochemical reactions is given in parentheses.
Figure 2
Figure 2
Central carbon metabolism of S. cerevisiae during aerobic growth on glucose. Gene names in boxes are given for reactions that were identified as flexible by flux balance analysis. Dark gray boxes indicate mutants, for which the carbon flux distribution was determined by 13C-tracer experiments. Dots indicate that the gene is part of a protein complex. Arrowheads indicate reaction reversibility. Extracellular substrates and products are capitalized. C1, one-carbon unit from C1 metabolism.
Figure 3
Figure 3
The distribution of six independently determined metabolic flux ratios in 37 deletion mutants during growth on glucose. In each case, the median of the distribution is indicated by a vertical line, the 25th percentile by the grey box and the 90th percentile by the horizontal line. Data points outside the 90th percentile are indicated by dots. The reference strain is indicated by the open circle.
Figure 4
Figure 4
Absolute metabolic fluxes in the 37 flexible mutants as a function of glucose uptake rate or selected intracellular fluxes. (a-f) Glucose uptake rate; (g,h) selected intracellular fluxes. The linear regression of the distribution and the 99% prediction interval are indicated by the solid and dashed lines, respectively. Mutants with significant changes in the carbon-flux distribution are indicated. The reference strain is indicated by an open circle. Extreme flux patterns were verified in 30-ml shake flask cultures (data not shown).
Figure 5
Figure 5
Relative distributions of absolute carbon fluxes in the S. cerevisiae reference strain (Ref) and the singleton gene mutants fum1, pda1 and zwf. All fluxes are normalized to the specific glucose uptake rate, which is shown in the top inset, and are given in the same order in each box. Reactions encoded by deleted genes are shown on a black background, but were not removed from the flux model (except for PDA1). The NADPH balance that is based on the quantified fluxes and the known cofactor specificities is given as a synthetic transhydrogenase flux. In general, the 95% confidence intervals were between 5 and 10% for the major fluxes. Larger confidence intervals were estimated for reactions with low flux such as malic enzyme and PEP carboxykinase. Flux distributions were verified in 30-ml shake flask cultures (data not shown). C1, one-carbon unit from C1 metabolism; P5P, pentose 5-phosphates.
Figure 6
Figure 6
Relative distributions of absolute carbon fluxes in the S. cerevisiae reference strain and the duplicate gene mutants ald6, cox5A and mdh1. All fluxes are normalized to the specific glucose uptake rate, which is shown in the top inset, and are given in the same order in each box. Reactions encoded by deleted genes are shown on a black background, but were not removed from the flux model. The NADPH balance that is based on the fluxes and the known cofactor specificities is given as a synthetic transhydrogenase. In general, the 95% confidence intervals were between 5 and 10% for the major fluxes. Larger confidence intervals were estimated for reactions with low flux such as malic enzyme and PEP carboxykinase. Flux distributions were verified in 30-ml shake flask cultures (data not shown). C1, one-carbon unit from C1 metabolism; P5P, pentose 5-phosphates.
Figure 7
Figure 7
The mechanistic basis of gene dispensability in all active reactions during glucose metabolism of S. cerevisiae. The mechanism was mostly identified from the phenotype on glucose plates. For 10 of the alternative pathways and for 20 duplicates encoding flexible reactions, the results were confirmed by 13C-flux analysis. For 22 duplicate genes the data are not sufficient to distinguish between both mechanisms and they are labeled as not analyzed.

Similar articles

Cited by

References

    1. Papin JA, Stelling J, Price ND, Klamt S, Schuster S, Palsson BO. Comparison of network-based pathway analysis methods. Trends Biotechnol. 2004;22:400–405. doi: 10.1016/j.tibtech.2004.06.010. - DOI - PubMed
    1. Price ND, Reed JL, Palsson BO. Genome-scale models of microbial cells: evaluating the consequences of constraints. Nat Rev Microbiol. 2004;2:886–897. doi: 10.1038/nrmicro1023. - DOI - PubMed
    1. Förster J, Famili I, Fu P, Palsson BO, Nielsen J. Genome-scale reconstruction of the Saccharomyces cerevisiae metabolic network. Genome Res. 2003;13:244–253. doi: 10.1101/gr.234503. - DOI - PMC - PubMed
    1. Reed JL, Palsson BO. Thirteen years of building constraint-based in silico models of Escherichia coli. J Bacteriol. 2003;185:2692–2699. doi: 10.1128/JB.185.9.2692-2699.2003. - DOI - PMC - PubMed
    1. Gu X. Evolution of duplicate genes versus genetic robustness against null mutations. Trends Genet. 2003;19:354–356. doi: 10.1016/S0168-9525(03)00139-2. - DOI - PubMed

Publication types