. 2005 Jun 17;121(6):937-50.
doi: 10.1016/j.cell.2005.04.009.

Single-molecule microscopy reveals plasma membrane microdomains created by protein-protein networks that exclude or trap signaling molecules in T cells

Affiliations

Single-molecule microscopy reveals plasma membrane microdomains created by protein-protein networks that exclude or trap signaling molecules in T cells

Adam D Douglass et al. Cell. .

Abstract

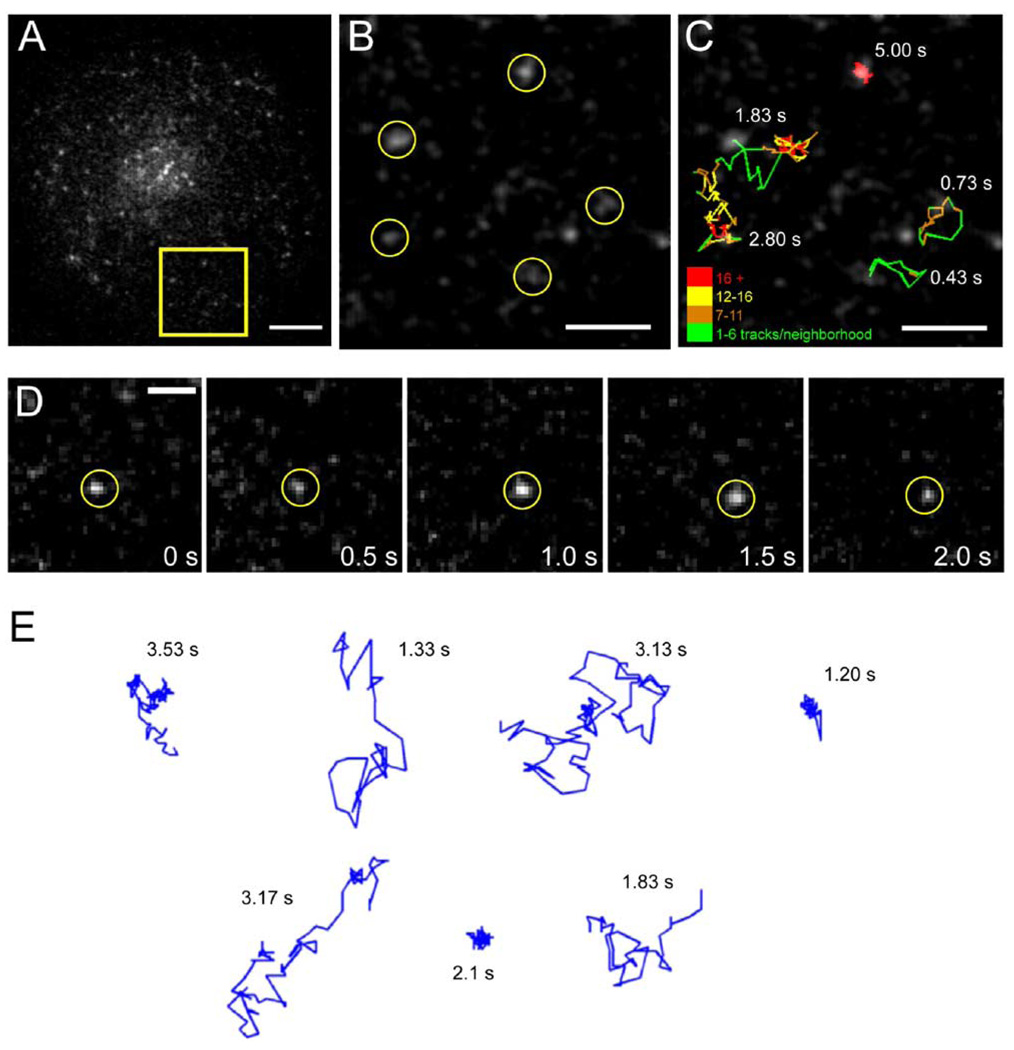
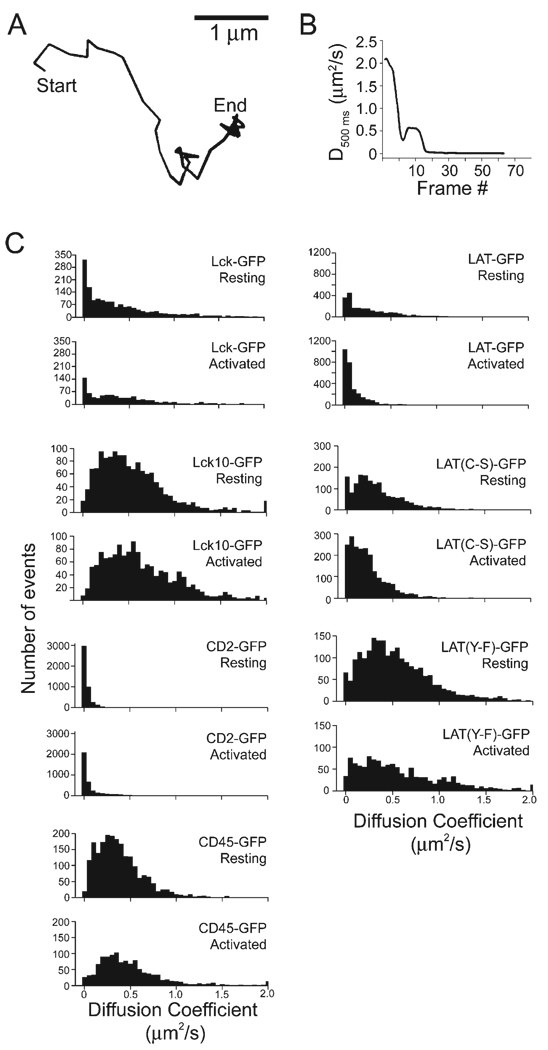
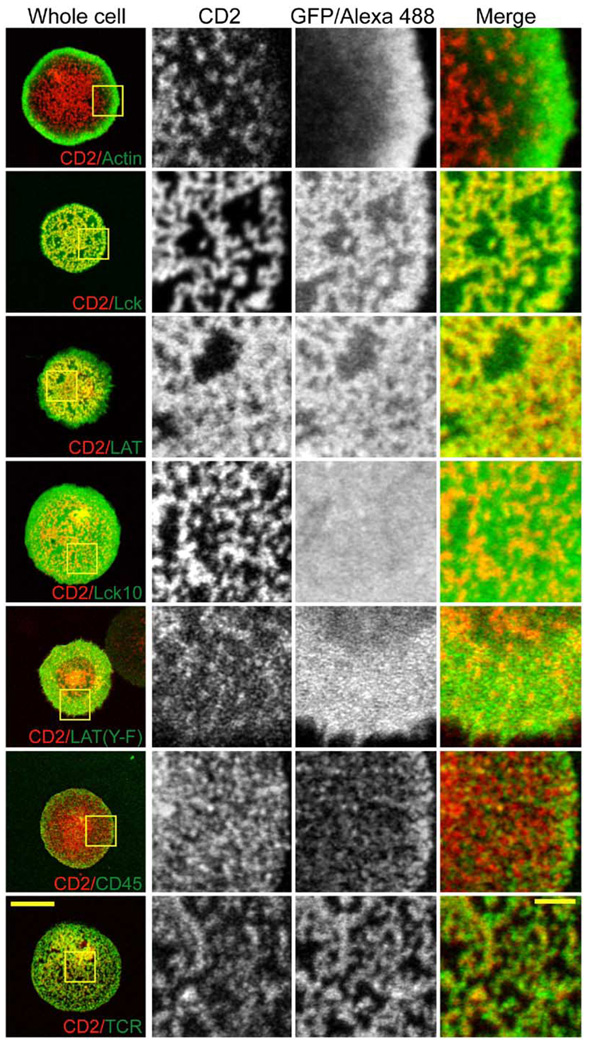
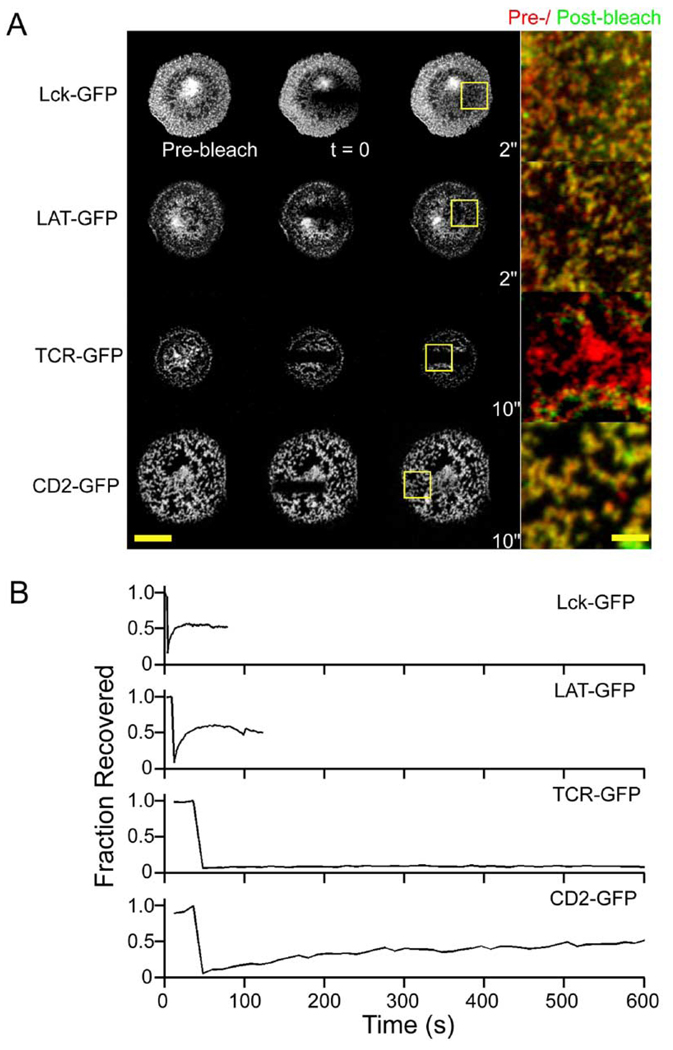
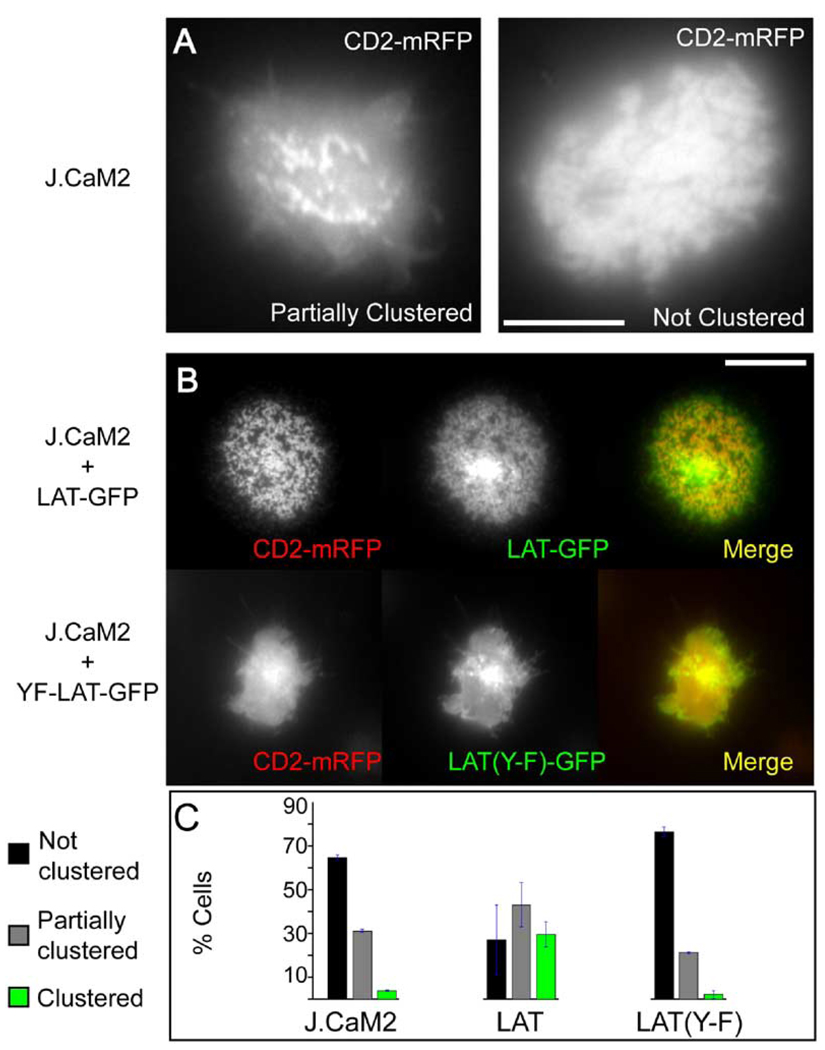
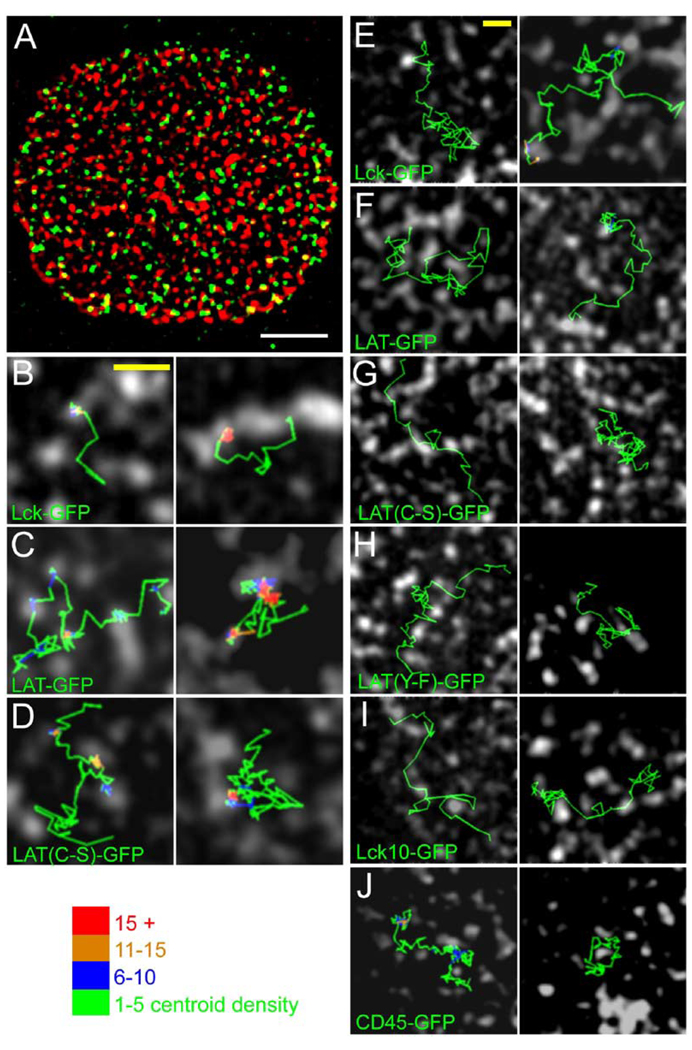
Membrane subdomains have been implicated in T cell signaling, although their properties and mechanisms of formation remain controversial. Here, we have used single-molecule and scanning confocal imaging to characterize the behavior of GFP-tagged signaling proteins in Jurkat T cells. We show that the coreceptor CD2, the adaptor protein LAT, and tyrosine kinase Lck cocluster in discrete microdomains in the plasma membrane of signaling T cells. These microdomains require protein-protein interactions mediated through phosphorylation of LAT and are not maintained by interactions with actin or lipid rafts. Using a two color imaging approach that allows tracking of single molecules relative to the CD2/LAT/Lck clusters, we demonstrate that these microdomains exclude and limit the free diffusion of molecules in the membrane but also can trap and immobilize specific proteins. Our data suggest that diffusional trapping through protein-protein interactions creates microdomains that concentrate or exclude cell surface proteins to facilitate T cell signaling.


Figures

Figure 1
Figure 1. Single-Molecule Imaging of Lck-GFP Reveals Heterogeneous Diffusion Behavior
Jurkat T cells were transiently transfected with Lck-GFP and imaged as described in the Experimental Procedures by TIRF microscopy to observe single molecules at the ventral cell surface. (A) A whole-cell image of spots corresponding to single Lck-GFP molecules. Scale bar, 5 µm. (B) Subregion of (A) showing the initial locations of five single molecules. Dim objects elsewhere in the image represent intensifier noise and background fluorescence. Scale bar, 2 µm. (C) Trajectories of the five molecules shown in (B), tracked at 30 frames/s. The total elapsed time for each trajectory is indicated in the figure. See also Movie S1. Trajectory color indicates the spatial density of single-molecule centroids within a 150 nm2 neighborhood, as a means of illustrating spatial confinement. Scale bar, 2 µm. (D) Time-lapse series of raw images showing diffusion of a single molecule of Lck-GFP. Scale bar, 1 µm. (E) Representative single-molecule trajectories showing highly mobile and immobile behavior, as well as transitions between the two modes. Scale bar, 2 µm.
Figure 2
Figure 2. Diffusional Immobilization and Response to TCR Signaling for Several GFP-Tagged Signaling Molecules
(A) and (B) illustrate the experimental determination of diffusion coefficients. In (A), a representative single-molecule trajectory is shown (duration = 2.90 s). (B) shows the diffusion coefficients for this trajectory, by generating mean square displacement versus time plots (0.5 s) for each sequential frame (see Experimental Procedures). (C) Histograms of diffusion coefficients are shown for unstimulated and TCR-activated cells for Lck-GFP, Lck10-GFP, LAT-GFP, LAT(C-S)-GFP, LAT(Y-F)-GFP, CD2-GFP, and CD45-GFP. Average values are reported in Table S1.
Figure 3
Figure 3. Formation of CD2-Enriched Signaling Domains in the Activated T Cell Surface
Jurkat cells were transiently transfected with CD2-mRFP and the indicated GFP fusion proteins. The planes of contact between the cells and anti-TCR antibody-coated coverslips were imaged by laser scanning confocal microscopy. Yellow boxes in column 1 indicate the expanded regions shown in columns 2–4. All imaging was performed in living cells at 37°C except for the CD2 + CD45 samples, which had to be fixed and stained by immunofluorescence since expression of CD45-RO-GFP at the cell surface is very low. Primary antibodies were labeled with Zenon labeling kits (Molecular Probes) to avoid labeling of the glass-adsorbed stimulatory antibody. Scale bars, 10 µm (whole cells) and 2 µm (expanded regions).
Figure 4
Figure 4. Signaling Clusters Are Static in Location but Exchange Molecules
Activated cells were subjected to FRAP analyses to determine the population-level diffusion dynamics of CD2-GFP, Lck-GFP, LAT-GFP, and TCRζ-GFP. A stripe of fluorescence at the cell-antibody interface was photobleached, and fluorescence recovery in these regions was examined after the bleach. (A) shows the raw images before, immediately after, and upon reaching maximal recovery after the bleach. Scale bar, 10 µm. The merged images show that the fluorescence in signaling clusters is replenished in their original locations after photobleaching. Scale bar, 2 µm. (B) Representative examples of fluorescence photobleaching recovery as a function of time.
Figure 5
Figure 5. Functional LAT Is Required for CD2 Clustering
(A) shows the LAT-deficient J.CaM2 cells that were transfected with CD2-mRFP and imaged by epifluorescence microscopy at the interface with the anti-TCR antibody-coated glass. Most cells either showed no (63%) or partial (31%) clustering of CD2, and rarely (5%) showed pronounced clustering like wild-type cells. Scale bar, 10 µm. (B) shows that CD2 clustering can be restored by transfection with LAT-GFP but not with LAT(Y-F)-GFP. Scale bar, 10 µm. (C) shows quantitation of CD2 clustering. Cells were visually scored as either unclustered, partially clustered, or fully clustered (see examples in [A] and [B]). Data shown are the mean and SEM of three independent transfection experiments (200–300 cells scored per experiment).
Figure 6
Figure 6. Dual-Color Imaging of Single GFP-Tagged Molecules Relative to CD2-mRFP Clusters
(A) A single frame from an image sequence of single molecules of Lck-GFP (green) that was superimposed upon a snapshot, bandpass-filtered image of CD2-mRFP clusters (red) (see Experimental Procedures). The movie of this cell can be found in Movie S3. (B)–(D) show centroid trajectories of single molecules of Lck-GFP, LAT-GFP, and LAT (C-S)-GFP, illustrating that they alternate between periods of immobilization within CD2 clusters and more rapid mobility outside of the clusters (see also Movies S7–S9). (E)–(J) show examples of several single-molecule trajectories in which centroid trajectories navigate in channels between CD2 zones (see also Movies S5 and S6). In (B)– (I), the trajectory color indicates the spatial density of single-molecule centroids within a 150 nm2 neighborhood, as a means of showing spatial confinement. Scale bars: (A) 5 µm, (B–I) 2 µm. The durations of each trace in seconds, in the left and right panels, are: (B) 1.00, 2.80 s; (C) 5.17, 6.03 s; (D) 3.77, 3.80 s; (E) 3.27, 4.57 s; (F) 2.83, 3.0 s; (G) 1.27, 3.63 s; (H) 2.63, 1.90 s; (I) 1.47, 2.10 s; (J) 4.93, 2.23 s.

Comment in

References

    1. Axelrod D. Total internal reflection fluorescence microscopy in cell biology. Methods Enzymol. 2003;361:1–33. - PubMed
    1. Bachmann MF, Barner M, Kopf M. CD2 sets quantitative thresholds in T cell activation. J. Exp. Med. 1999;190:1383–1392. - PMC - PubMed
    1. Badour K, Zhang J, Shi F, McGavin MK, Rampersad V, Hardy LA, Field D, Siminovitch KA. The Wiskott-Aldrich syndrome protein acts downstream of CD2 and the CD2AP and PSTPIP1 adaptors to promote formation of the immunological synapse. Immunity. 2003;18:141–154. - PubMed
    1. Bierer BE, Hahn WC. T cell adhesion, avidity regulation and signaling: a molecular analysis of CD2. Semin. Immunol. 1993;5:249–261. - PubMed
    1. Bonello G, Blanchard N, Montoya MC, Aguado E, Langlet C, He HT, Nunez-Cruz S, Malissen M, Sanchez-Madrid F, Olive D, et al. Dynamic recruitment of the adaptor protein LAT: LAT exists in two distinct intracellular pools and controls its own recruitment. J. Cell Sci. 2004;117:1009–1016. - PubMed

Publication types

MeSH terms

Substances