

Single-file electrophoretic transport and counting of individual DNA molecules in surfactant nanotubes
- PMID: 15961544
- PMCID: PMC1166592
- DOI: 10.1073/pnas.0500081102
Single-file electrophoretic transport and counting of individual DNA molecules in surfactant nanotubes
Abstract
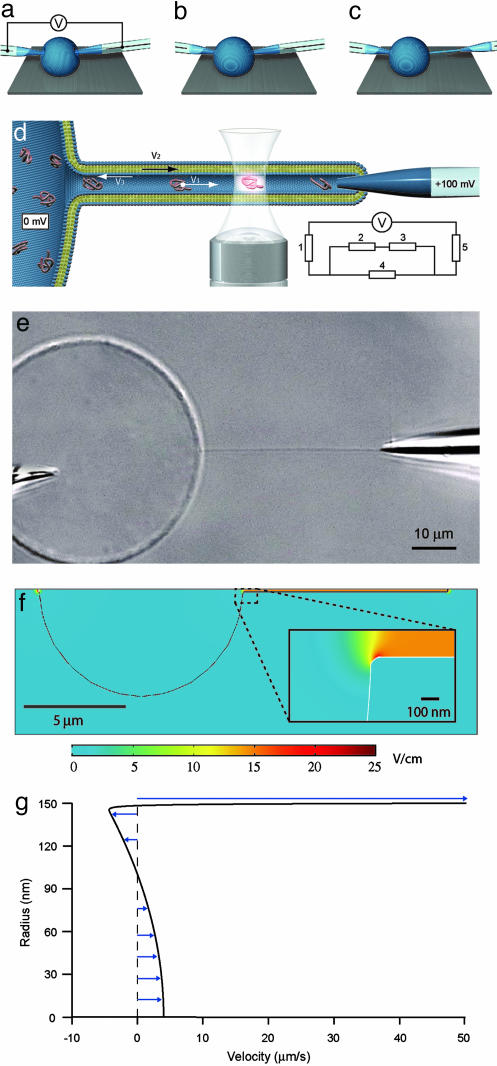
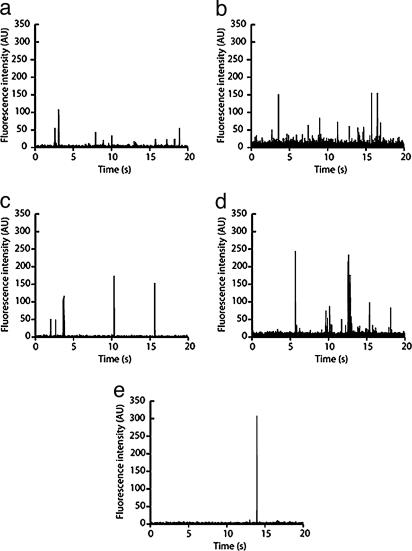
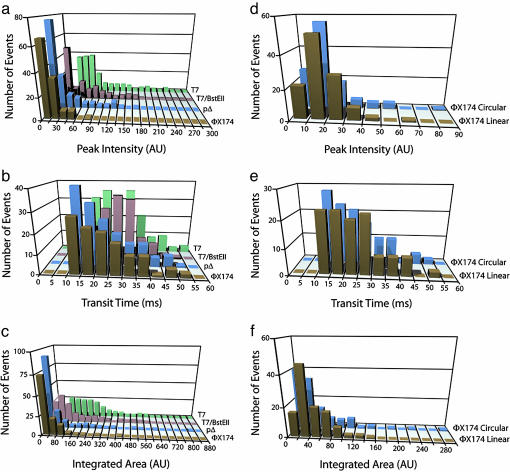
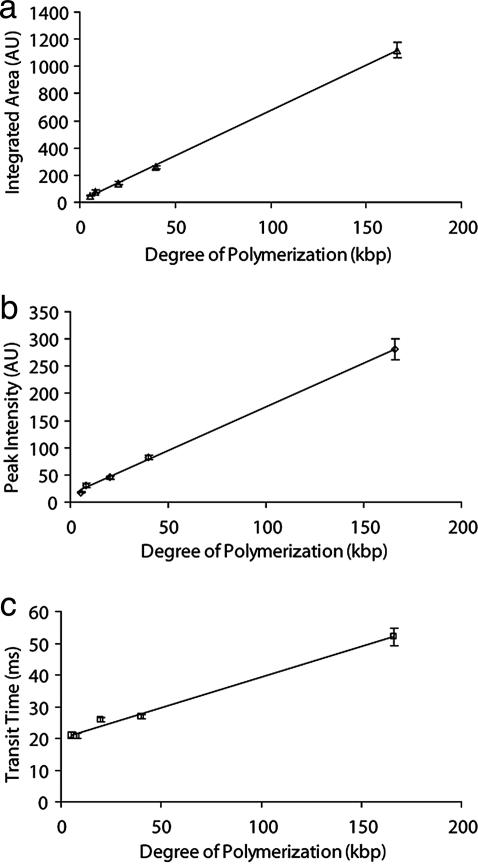
We demonstrate a complete nanotube electrophoresis system (nanotube radii in the range of 50 to 150 nm) based on lipid membranes, comprising DNA injection, single-molecule transport, and single-molecule detection. Using gel-capped electrodes, electrophoretic single-file transport of fluorescently labeled dsDNA molecules is observed inside nanotubes. The strong confinement to a channel of molecular dimensions ensures a detection efficiency close to unity and identification of DNA size from its linear relation to the integrated peak intensity. In addition to constituting a nanotechnological device for identification and quantification of single macromolecules or biopolymers, this system provides a method to study their conformational dynamics, reaction kinetics, and transport in cell-like environments.
Figures
Similar articles
-
Electrophoretic transport in surfactant nanotube networks wired on microfabricated substrates.Anal Chem. 2006 Aug 1;78(15):5281-8. doi: 10.1021/ac060229i. Anal Chem. 2006. PMID: 16878860
-
Nanofluidic networks based on surfactant membrane technology.Anal Chem. 2003 Jun 1;75(11):2529-37. doi: 10.1021/ac0340206. Anal Chem. 2003. PMID: 12948118
-
Fluid mixing in growing microscale vesicles conjugated by surfactant nanotubes.J Am Chem Soc. 2005 Feb 2;127(4):1251-7. doi: 10.1021/ja0451113. J Am Chem Soc. 2005. PMID: 15669864
-
Fluorescence spectroscopy of single biomolecules.Science. 1999 Mar 12;283(5408):1676-83. doi: 10.1126/science.283.5408.1676. Science. 1999. PMID: 10073925 Review.
-
Biomimetic DNA Nanotubes: Nanoscale Channel Design and Applications.Angew Chem Int Ed Engl. 2019 Jul 1;58(27):8996-9011. doi: 10.1002/anie.201807779. Epub 2019 Apr 4. Angew Chem Int Ed Engl. 2019. PMID: 30290046 Review.
Cited by
-
Animal cells connected by nanotubes can be electrically coupled through interposed gap-junction channels.Proc Natl Acad Sci U S A. 2010 Oct 5;107(40):17194-9. doi: 10.1073/pnas.1006785107. Epub 2010 Sep 20. Proc Natl Acad Sci U S A. 2010. PMID: 20855598 Free PMC article.
-
Harnessing liquid-in-liquid printing and micropatterned substrates to fabricate 3-dimensional all-liquid fluidic devices.Nat Commun. 2019 Mar 6;10(1):1095. doi: 10.1038/s41467-019-09042-y. Nat Commun. 2019. PMID: 30842556 Free PMC article.
-
Single nanopore transport of synthetic and biological polyelectrolytes in three-dimensional hybrid microfluidicnanofluidic devices.Biomicrofluidics. 2009 Jan 2;3(1):12004. doi: 10.1063/1.3059546. Biomicrofluidics. 2009. PMID: 19693385 Free PMC article.
-
The multiple faces of self-assembled lipidic systems.PMC Biophys. 2009 Apr 17;2(1):3. doi: 10.1186/1757-5036-2-3. PMC Biophys. 2009. PMID: 19374753 Free PMC article.
-
Lipid tubule growth by osmotic pressure.J R Soc Interface. 2013 Sep 4;10(88):20130637. doi: 10.1098/rsif.2013.0637. Print 2013 Nov 6. J R Soc Interface. 2013. PMID: 24004559 Free PMC article.
References
-
- Rustom, A., Saffrich, R., Markovic, I., Walther, P. & Gerdes, H. H. (2004) Science 303, 1007-1010. - PubMed
-
- Stange, P., Zanette, D., Mikhailov, A. & Hess, B. (1998) Biophys. Chem. 72, 73-85. - PubMed
-
- Hess, B. & Mikhailov, A. (1996) Biophys. Chem. 58, 365-368. - PubMed
-
- Khairutdinov, R. F. & Serpone, N. (1996) Progr. Reaction Kinetics 21, 1-68.
-
- Sesso, A., Defaria, F. P., Iwamura, E. S. M. & Correa, H. (1994) J. Cell Sci. 107, 517-528. - PubMed
Publication types
MeSH terms
Substances
LinkOut - more resources
Full Text Sources
