. 2005 Jul;42(1):104-12.
doi: 10.1002/hep.20749.

Comprehensive analyses of CD8+ T cell responses during longitudinal study of acute human hepatitis C

Affiliations

Comprehensive analyses of CD8+ T cell responses during longitudinal study of acute human hepatitis C

Andrea L Cox et al. Hepatology. 2005 Jul.

Abstract

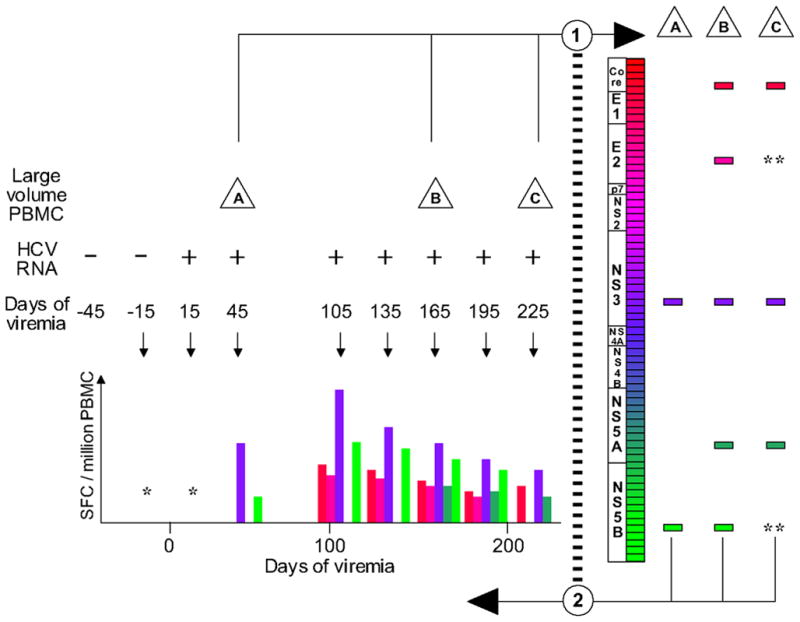
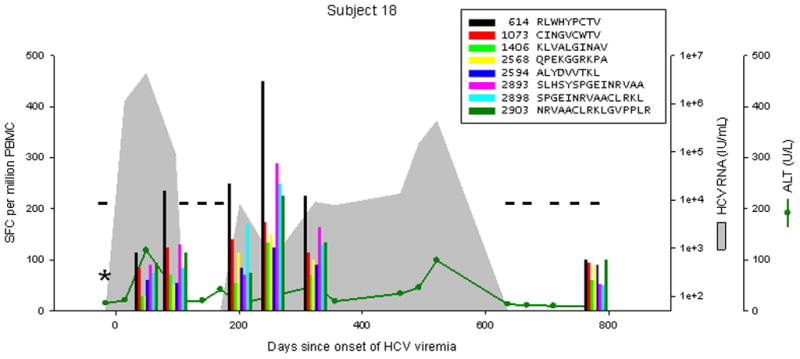
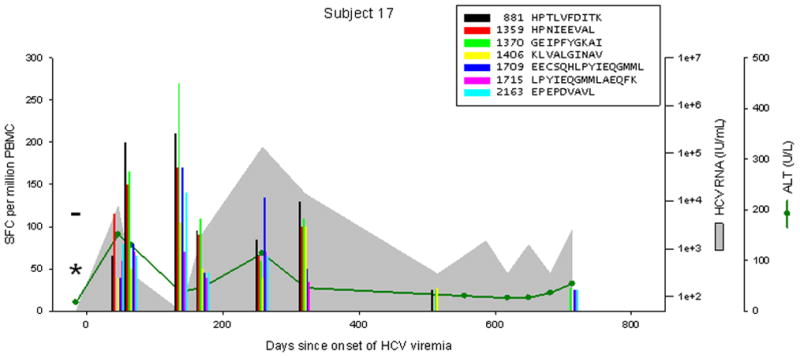
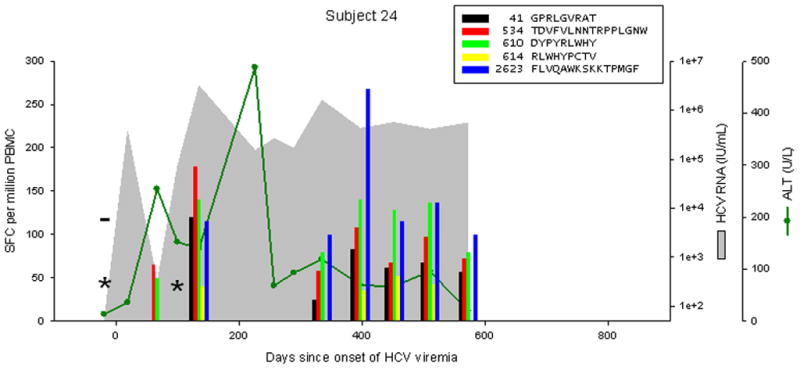
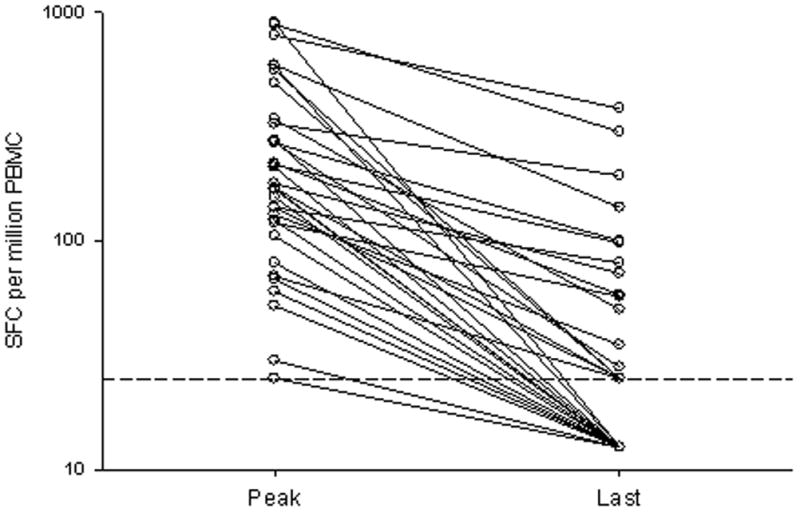
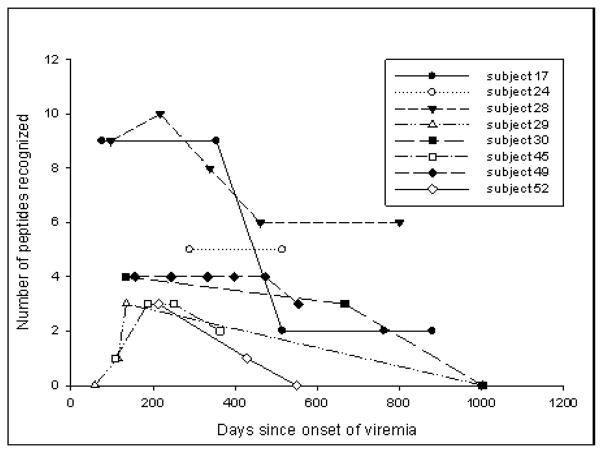
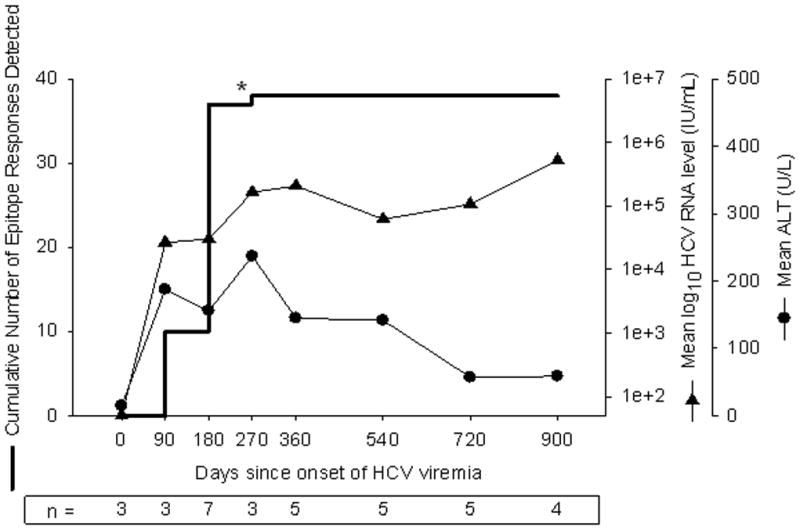
We comprehensively studied the cellular immune response during acute human hepatitis C virus (HCV) infection by monthly prospective sampling of persons at high risk of infection. In 19 of 23 subjects, interferon-gamma-secreting T cells specific for 1 or more peptides spanning the entire HCV polyprotein were detected 1 to 3 months after infection. The median time to development of interferon gamma responses to HCV peptides was 33 days (range, 29-50 days), and these responses peaked between 180 and 360 days. Nineteen subjects had sufficient follow-up to determine outcome, with 15 (79%) developing persistent viremia and 4 (21%) clearing viremia spontaneously. Of those with progression to chronic infection and detectable T cell responses, all lost recognition of one or more antigens recognized during acute infection, and the median reduction in the magnitude of responses was 85%. Most significantly, despite ongoing viremia, those who had persistent infection did not develop new epitope specificities after the first 6 months of infection. In conclusion, in most individuals, the CD8+ T cell responses generated early in HCV infection decline in peripheral blood and are not replaced with new responses. Supplementary material for this article can be found on the HEPATOLOGY website (http://www.interscience.wiley.com/jpages/0270-9139/suppmat/index.html).


Figures

Figure 1
Figure 1
Schema for comprehensive and longitudinal analysis of cellular immune responses to HCV. Prospectively collected specimens were tested for HCV RNA, and the date of onset of viremia was estimated as the midpoint between repeatedly negative and positive specimens. In step 1, large-volume specimens (depicted as triangles A, B, and C) were screened using overlapping peptides, depicted as a series of rectangles along the HCV genome map, and detected responses are depicted as distinct rectangles to the right. In step 2, all peptides eliciting a detectable response were used to determine the temporal course of recognition in monthly smaller-volume PBMC specimens (hypothetical results are depicted, meant to be analogous to figure 2). Occasional missed visits are illustrated by a gap between the visits at 45 and 105 days of viremia; “*” indicates no responses were detected to any peptide when tested in a monthly specimen; “**” indicates a previously-detected peptide response not detected at that screening visit.
Figure 2
Figure 2
Levels of CTL response, HCV RNA, and ALT during acute HCV infection in 4 individuals. Subject 18 cleared infection after 600 days of viremia. Subjects 17, 24, and 29 progressed to chronic infection. The legend indicates peptide position (relative to H77 polyprotein, Genbank accession #AF009606) and sequence. Responses below 25 SFC per million PBMC are not shown. CTL responses were measured by IFNγ Elispot; “*” indicates no responses were detected to any peptide recognized in other specimens. HCV RNA levels below the limit of quantitation are plotted at 50 IU/mL; “−“ indicates specimens were also negative for HCV RNA by qualitative assay. The point of initial viremia was estimated as the midpoint between the last sample with undetectable HCV RNA and the first sample with detectable HCV RNA.
Figure 2
Figure 2
Levels of CTL response, HCV RNA, and ALT during acute HCV infection in 4 individuals. Subject 18 cleared infection after 600 days of viremia. Subjects 17, 24, and 29 progressed to chronic infection. The legend indicates peptide position (relative to H77 polyprotein, Genbank accession #AF009606) and sequence. Responses below 25 SFC per million PBMC are not shown. CTL responses were measured by IFNγ Elispot; “*” indicates no responses were detected to any peptide recognized in other specimens. HCV RNA levels below the limit of quantitation are plotted at 50 IU/mL; “−“ indicates specimens were also negative for HCV RNA by qualitative assay. The point of initial viremia was estimated as the midpoint between the last sample with undetectable HCV RNA and the first sample with detectable HCV RNA.
Figure 3
Figure 3
Loss of breadth and magnitude of cellular immune responses during the transition from acute to chronic HCV infection. Results from eight subjects (17, 24, 28, 29, 45, 49, 52, 55) with detectable cellular responses and with sufficient PBMC for frequent study. (A) Magnitude of response, expressed at the number of IFNγ SFC per million PBMC at peak (the specimen in which the maximal response to that peptide was detected, median 213 days and range 106 to 452 after the onset of viremia) and last specimen examined (median 642 and range, 363 to 970 days after the onset of viremia). The horizontal dashed line indicates the limit of detection. (B) Breadth of response, expressed as number of peptides recognized over time.
Figure 3
Figure 3
Loss of breadth and magnitude of cellular immune responses during the transition from acute to chronic HCV infection. Results from eight subjects (17, 24, 28, 29, 45, 49, 52, 55) with detectable cellular responses and with sufficient PBMC for frequent study. (A) Magnitude of response, expressed at the number of IFNγ SFC per million PBMC at peak (the specimen in which the maximal response to that peptide was detected, median 213 days and range 106 to 452 after the onset of viremia) and last specimen examined (median 642 and range, 363 to 970 days after the onset of viremia). The horizontal dashed line indicates the limit of detection. (B) Breadth of response, expressed as number of peptides recognized over time.
Figure 4
Figure 4
Arrest in development and maintenance of cellular immune responses during the transition from acute to chronic infection. Results from seven subjects with detectable responses and sufficient PBMC for frequent study are summarized with respect to cumulative number of responses detected, geometric mean HCV RNA level, and arithmetic mean ALT. For each time point, the data represent observations during the preceding interval. An outlier event in subject 28 indicated by “*” was detected at 217 days after onset of viremia, and no specimen was available between days 97 and 217; this response might have been detected prior to day 180 if intervening specimens had been available. Because time zero is defined as the midpoint between the last HCV RNA negative specimen and the first HCV RNA positive specimen, the data for time zero represent specimens obtained prior to viremia. The open symbol for HCV RNA level indicates HCV RNA less than 50 IU/mL.

References

    1. World Health Organization. Hepatitis C: global prevalence. Weekly Epidemiological Record. 1997;(72):341–348. - PubMed
    1. Alter MJ. Epidemiology of hepatitis C. Hepatology. 1997;26(3 Suppl 1):62S–65S. - PubMed
    1. Alter MJ. Epidemiology of hepatitis C in the West. Semin Liver Dis. 1995;15:5–14. - PubMed
    1. Centers for Disease Control and Prevention. Recommendations for prevention and control of hepatitis C virus (HCV) infection and HCV-related chronic disease. MMWR. 1998;47(RR19):1–39. - PubMed
    1. Villano SA, Vlahov D, Nelson KE, Cohn S, Thomas DL. Persistence of viremia and the importance of long-term follow-up after acute hepatitis C infection. Hepatology. 1999;29(3):908–914. - PubMed

Publication types