

A generic approach for the design of whole-genome oligoarrays, validated for genomotyping, deletion mapping and gene expression analysis on Staphylococcus aureus
- PMID: 15963225
- PMCID: PMC1183204
- DOI: 10.1186/1471-2164-6-95
A generic approach for the design of whole-genome oligoarrays, validated for genomotyping, deletion mapping and gene expression analysis on Staphylococcus aureus
Abstract
Background: DNA microarray technology is widely used to determine the expression levels of thousands of genes in a single experiment, for a broad range of organisms. Optimal design of immobilized nucleic acids has a direct impact on the reliability of microarray results. However, despite small genome size and complexity, prokaryotic organisms are not frequently studied to validate selected bioinformatics approaches. Relying on parameters shown to affect the hybridization of nucleic acids, we designed freely available software and validated experimentally its performance on the bacterial pathogen Staphylococcus aureus.
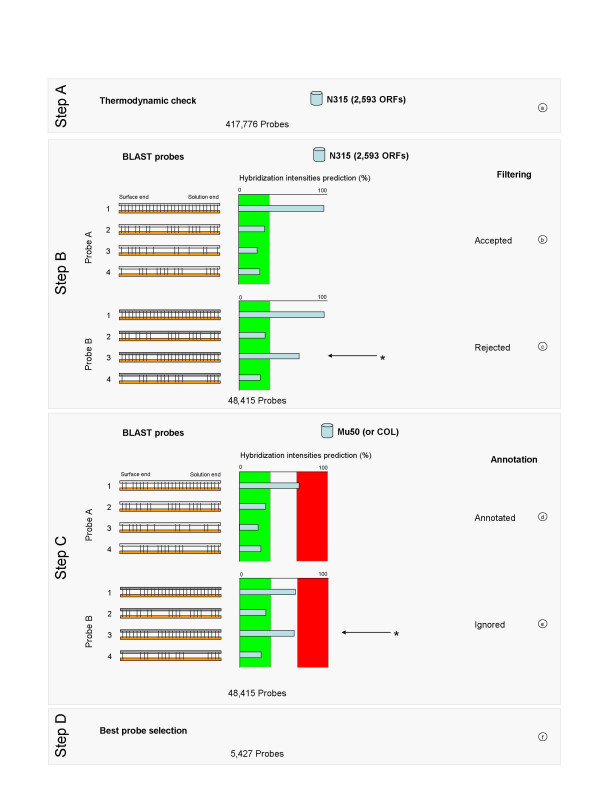
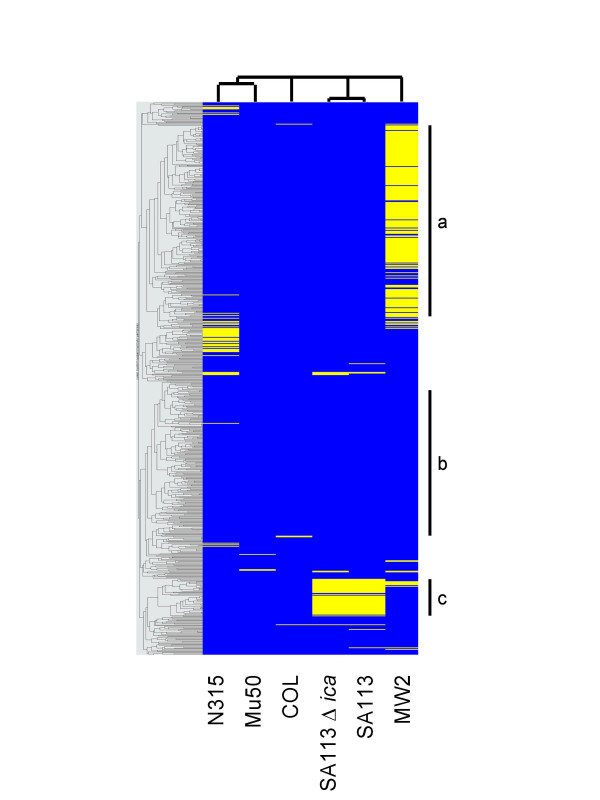
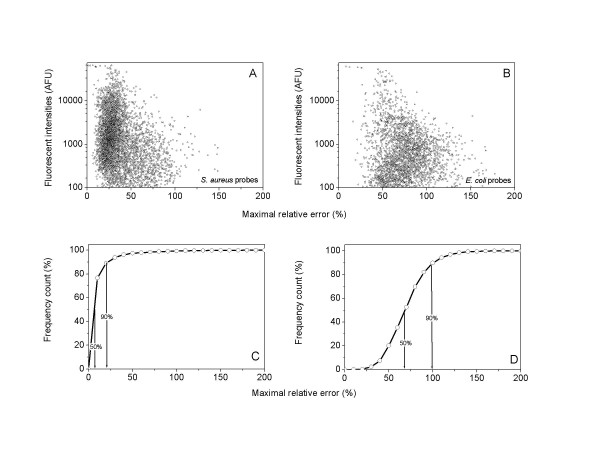
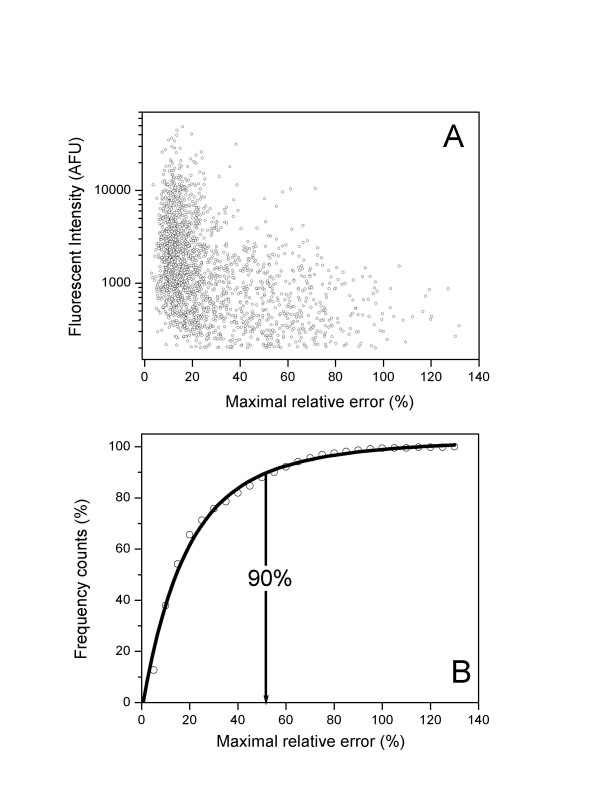
Results: We describe an efficient procedure for selecting 40-60 mer oligonucleotide probes combining optimal thermodynamic properties with high target specificity, suitable for genomic studies of microbial species. The algorithm for filtering probes from extensive oligonucleotides libraries fitting standard thermodynamic criteria includes positional information of predicted target-probe binding regions. This algorithm efficiently selected probes recognizing homologous gene targets across three different sequenced genomes of Staphylococcus aureus. BLAST analysis of the final selection of 5,427 probes yielded >97%, 93%, and 81% of Staphylococcus aureus genome coverage in strains N315, Mu50, and COL, respectively. A manufactured oligoarray including a subset of control Escherichia coli probes was validated for applications in the fields of comparative genomics and molecular epidemiology, mapping of deletion mutations and transcription profiling.
Conclusion: This generic chip-design process merging sequence information from several related genomes improves genome coverage even in conserved regions.
Figures


Similar articles
-
Secondary structure in the target as a confounding factor in synthetic oligomer microarray design.BMC Genomics. 2005 Mar 8;6:31. doi: 10.1186/1471-2164-6-31. BMC Genomics. 2005. PMID: 15755320 Free PMC article.
-
Selection of long oligonucleotides for gene expression microarrays using weighted rank-sum strategy.BMC Bioinformatics. 2007 Sep 19;8:350. doi: 10.1186/1471-2105-8-350. BMC Bioinformatics. 2007. PMID: 17880708 Free PMC article.
-
Genomic analysis of gene expression of Staphylococcus aureus.Methods Mol Biol. 2007;391:169-78. doi: 10.1007/978-1-59745-468-1_13. Methods Mol Biol. 2007. PMID: 18025677
-
Applications of DNA microarrays in microbial systems.J Microbiol Methods. 2001 Dec;47(3):257-72. doi: 10.1016/s0167-7012(01)00308-6. J Microbiol Methods. 2001. PMID: 11714516 Review.
-
Mathematical tools to optimize the design of oligonucleotide probes and primers.Appl Microbiol Biotechnol. 2014 Dec;98(23):9595-608. doi: 10.1007/s00253-014-6165-x. Epub 2014 Oct 31. Appl Microbiol Biotechnol. 2014. PMID: 25359473 Review.
Cited by
-
Genome-wide transcriptional response of the archaeon Thermococcus gammatolerans to cadmium.PLoS One. 2012;7(7):e41935. doi: 10.1371/journal.pone.0041935. Epub 2012 Jul 27. PLoS One. 2012. PMID: 22848664 Free PMC article.
-
Microarray comparative genomic hybridisation analysis incorporating genomic organisation, and application to enterobacterial plant pathogens.PLoS Comput Biol. 2009 Aug;5(8):e1000473. doi: 10.1371/journal.pcbi.1000473. Epub 2009 Aug 21. PLoS Comput Biol. 2009. PMID: 19696881 Free PMC article.
-
Staphylococcusaureus Transcriptome Data and Metabolic Modelling Investigate the Interplay of Ser/Thr Kinase PknB, Its Phosphatase Stp, the glmR/yvcK Regulon and the cdaA Operon for Metabolic Adaptation.Microorganisms. 2021 Oct 14;9(10):2148. doi: 10.3390/microorganisms9102148. Microorganisms. 2021. PMID: 34683468 Free PMC article.
-
Transgenic zebrafish line with over-expression of Hedgehog on the skin: a useful tool to screen Hedgehog-inhibiting compounds.Transgenic Res. 2009 Dec;18(6):855-64. doi: 10.1007/s11248-009-9275-y. Epub 2009 May 3. Transgenic Res. 2009. PMID: 19412740
-
Rickettsia conorii transcriptional response within inoculation eschar.PLoS One. 2008;3(11):e3681. doi: 10.1371/journal.pone.0003681. Epub 2008 Nov 10. PLoS One. 2008. PMID: 18997861 Free PMC article.
References
-
- Lucchini S, Thompson A, Hinton JC. Microarrays for microbiologists. Microbiology. 2001;147:1403–1414. - PubMed
Publication types
MeSH terms
Substances
LinkOut - more resources
Full Text Sources
Research Materials
Miscellaneous
