. 2005 Jul;15(7):978-86.
doi: 10.1101/gr.3804205. Epub 2005 Jun 17.

Physicochemical constraint violation by missense substitutions mediates impairment of protein function and disease severity

Affiliations

Physicochemical constraint violation by missense substitutions mediates impairment of protein function and disease severity

Eric A Stone et al. Genome Res. 2005 Jul.

Abstract

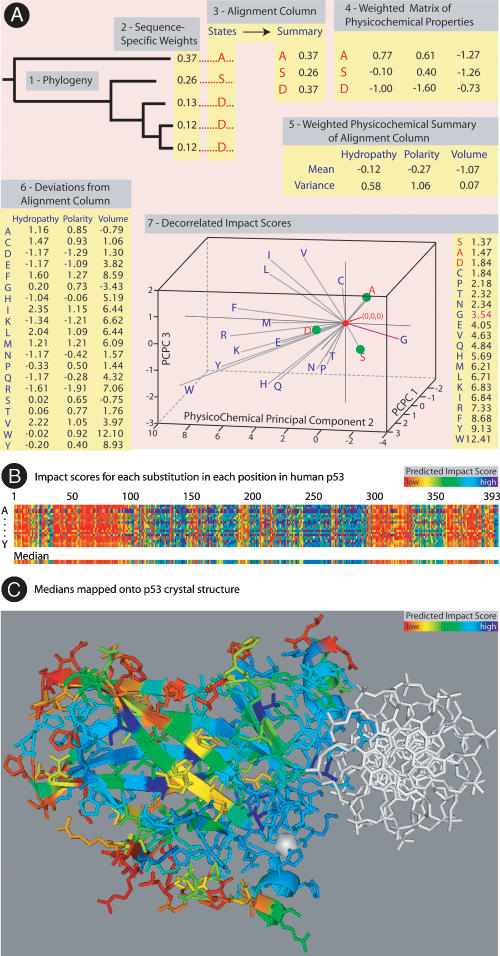
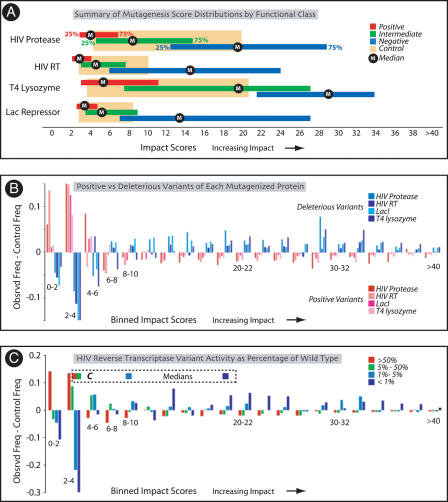
We find that the degree of impairment of protein function by missense variants is predictable by comparative sequence analysis alone. The applicable range of impairment is not confined to binary predictions that distinguish normal from deleterious variants, but extends continuously from mild to severe effects. The accuracy of predictions is strongly dependent on sequence variation and is highest when diverse orthologs are available. High predictive accuracy is achieved by quantification of the physicochemical characteristics in each position of the protein, based on observed evolutionary variation. The strong relationship between physicochemical characteristics of a missense variant and impairment of protein function extends to human disease. By using four diverse proteins for which sufficient comparative sequence data are available, we show that grades of disease, or likelihood of developing cancer, correlate strongly with physicochemical constraint violation by causative amino acid variants.


Figures

Figure 1.
Figure 1.
(A) MAPP's seven analysis steps. Evolutionary relationships of the protein sequences in the multiple alignment are inferred by likelihood analysis (1). Weights for each sequence are calculated to control for phylogenetic correlation (2). (The remaining steps consider each position in the protein independently and are illustrated for one such position.) Each column of the alignment is condensed into a summary in which each of the 20 amino acids is represented by the sum of the weights of those sequences carrying the amino acid at that position in the alignment (3). The summary is interpreted using a universal matrix of physicochemical property scales, only three of which are shown: hydropathy, polarity, and volume (4). The result is an estimate of the physicochemical constraints on each position in terms of the mean and variance of the property distributions observed in its alignment column (5). Deviations from the alignment column are obtained for each possible variant by calculating its property difference from the mean and dividing by the square root of the variance (6). To compute a single score measuring the violation of constraint across all properties, we first decorrelate the properties themselves by using a principal component transformation. The decorrelation gives rise to a new coordinate system in which each axis is a principal component; the distance from the origin to any variant is the variant's decorrelated impact score (7). (B) Each possible variant at each position in the protein is color-coded by its MAPP score, shown here for human p53. Each column corresponds to a position in human p53, in order of sequence. The spectrum of possible variants at each position reads from top to bottom, arranged alphabetically by one-letter amino-acid abbreviation. Scores for each variant are color-coded from low (red) to high (blue) as a heat map, with temperature inverse to the predicted impact of that change on the protein. The median score of possible variants at each position is shown below with the same color code. This median was used to color C. (C) Median MAPP scores plotted on the crystal structure of human p53 (Cho et al. 1994; DeLano 2002). Chelated Zinc and bound DNA are white.
Figure 2.
Figure 2.
Comparison of MAPP scores of protein variants with mutagenesis studies. (A) Scores of protein variants assayed in the four mutagenesis experiments. Variants were partitioned by function as positive (red), intermediate (green), or negative (blue). The interquartile range (25%–75%) of MAPP scores for each set is shown, with the median value denoted by the M. Interquartile ranges of control distributions are in tan. (B) Deleterious variants (blue; intermediate plus negative from A) and positive variants (red; from A) are contrasted. MAPP scores for each set were segregated in bins of width two from zero to 40 (shown left to right); observed frequencies were calculated by dividing bin counts by the total number of variants in that set. Vertical bars show the difference between observed frequencies and control frequencies, with the latter obtained similarly from the appropriate control distribution. (C) Contrast between experimental distribution versus control distribution as in B of HIV reverse transcriptase variants. Variants were partitioned by enzymatic activity relative to wild-type (>50%, red; >5% but ≤50%, green; >1% but ≤5%, light blue; ≤1%, dark blue). Colored squares show the median MAPP score of each variant class above the bin to which it belongs, with C representing the median of the control distribution.
Figure 3.
Figure 3.
Effect of paralogous sequences on prediction accuracy. (A) Differential accuracy in MAPP classification of LacI variants implicated in ligand binding when different types of homologs are represented in the alignment. Three types of alignment are compared. Variants classified at each position are arranged from top to bottom alphabetically by one-letter abbreviation. Positions are shown left to right in increasing order (24). Green and red identify correct and incorrect predictions, respectively, of whether a variant is functional versus deleterious; the wild-type amino acid is blue. (B) Classification of 5000 alignments, each containing LacI and five sequences randomly chosen from the original alignment. Accuracy is plotted against total evolutionary divergence as measured in substitutions per site for random alignments (blue) and the single alignment of six orthologs (red).
Figure 4.
Figure 4.
HIV protease variant frequencies versus MAPP score. (A) Frequency of each variant by position within the population of untreated individuals plotted against its MAPP score. Rare variants (frequency <0.1%) are in blue, common variants (frequency >5%) are in red, and those in between are in green. Variants known to confer resistance to protease inhibitors are the bordered squares; the remaining variants are circles. (B) Plot of variant frequency after treatment with protease inhibitor(s). Common variants with high MAPP scores are labeled and ranked by effectiveness in conferring resistance. Color-coding of variants is by their frequency in untreated patients, as in A, for comparison.
Figure 5.
Figure 5.
MAPP score distributions of disease variants grouped by severity of disease. Frequency differences between classes of variants and their respective control distributions are computed and shown as in Figure 2. Median scores of the original distributions are shown above the score bin into which they fall. (A) Frequency differences between distributions of anemia variants that cause hemolytic anemia and control distributions, for G6PD (green), pyruvate kinase (light blue), and β hemoglobin (dark blue). The shifts in medians from the control distribution (C) to the disease distribution (D) are indicated above their bin. (B) Comparisons among score distributions of β hemoglobin variants. Frequency differences and median scores are shown by phenotype (normal, red; erythocytosis, green; anemia, light blue; Heinz bodies, dark blue). (C) Comparisons among score distributions of β hemoglobin variants that cause anemia, graded by severity of the disease. Frequency differences and median scores are shown by severity of anemia (mild, green; moderate, light blue; severe, dark blue). (D) Scores of p53 variants isolated from somatic tumors. Frequency differences from control, and median scores, are shown for variants stratified by incidence (score 0, red; scores 1–4, orange; scores 5–9, green; 10+, blue). C indicates median score for control distribution; LF, median score for distribution of Li Fraumeni variants.

References

    1. Altschul, S.F., Carroll, R.J., and Lipman, D.J. 1989. Weights for data related by a tree. J. Mol. Biol. 207: 647-653. - PubMed
    1. Botstein, D. and Risch, N. 2003. Discovering genotypes underlying human phenotypes: Past successes for mendelian disease, future approaches for complex disease. Nat. Genet. 33(Suppl): 228-237. - PubMed
    1. Cai, Z., Tsung, E.F., Marinescu, V.D., Ramoni, M.F., Riva, A., and Kohane, I.S. 2004. Bayesian approach to discovering pathogenic SNPs in conserved protein domains. Hum. Mutat. 24: 178-184. - PubMed
    1. Cho, Y., Gorina, S., Jeffrey, P.D., and Pavletich, N.P. 1994. Crystal structure of a p53 tumor suppressor–DNA complex: Understanding tumorigenic mutations. Science 265: 346-355. - PubMed
    1. Coffin, J.M. 1995. HIV population dynamics in vivo: Implications for genetic variation, pathogenesis, and therapy. Science 267: 483-488. - PubMed

Publication types