

Phytochrome B in the mesophyll delays flowering by suppressing FLOWERING LOCUS T expression in Arabidopsis vascular bundles
- PMID: 15965119
- PMCID: PMC1167543
- DOI: 10.1105/tpc.105.032342
Phytochrome B in the mesophyll delays flowering by suppressing FLOWERING LOCUS T expression in Arabidopsis vascular bundles
Abstract
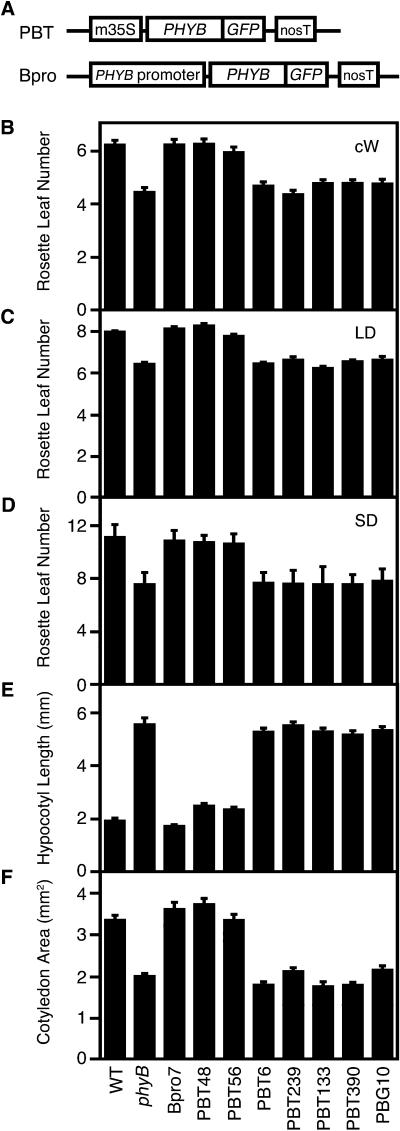
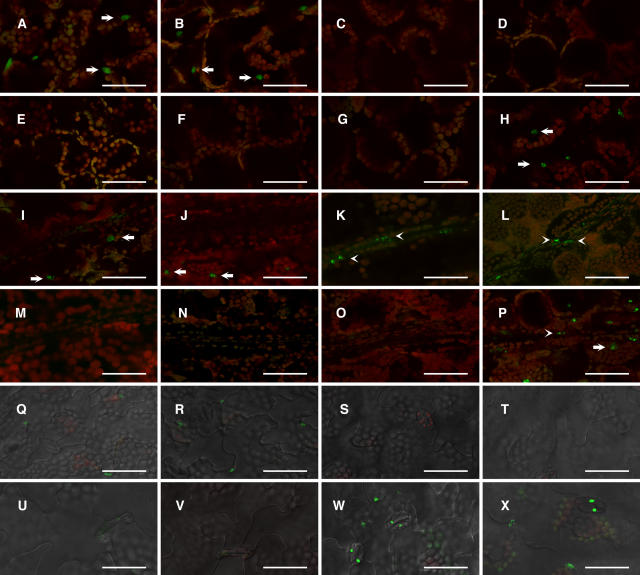
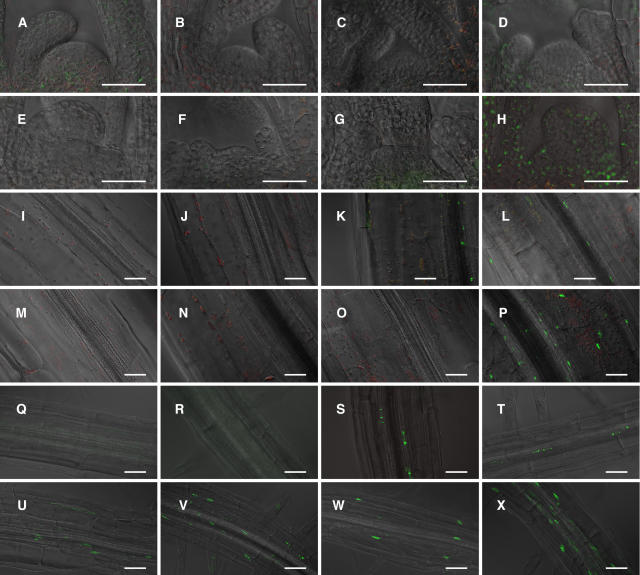
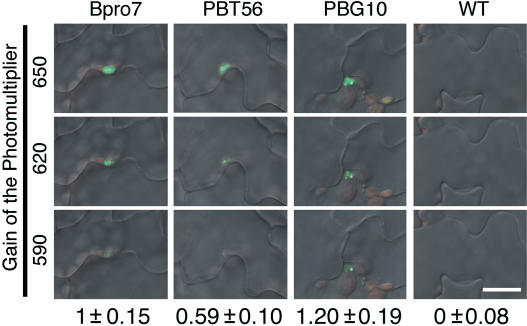
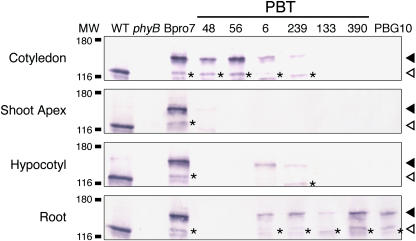
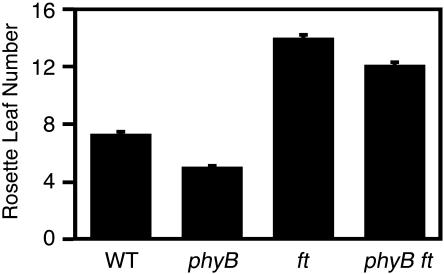
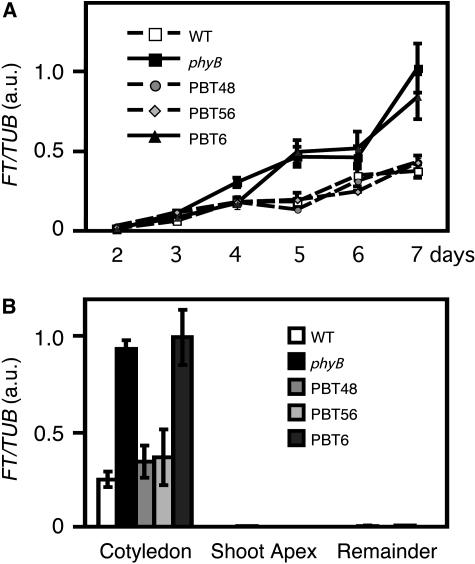
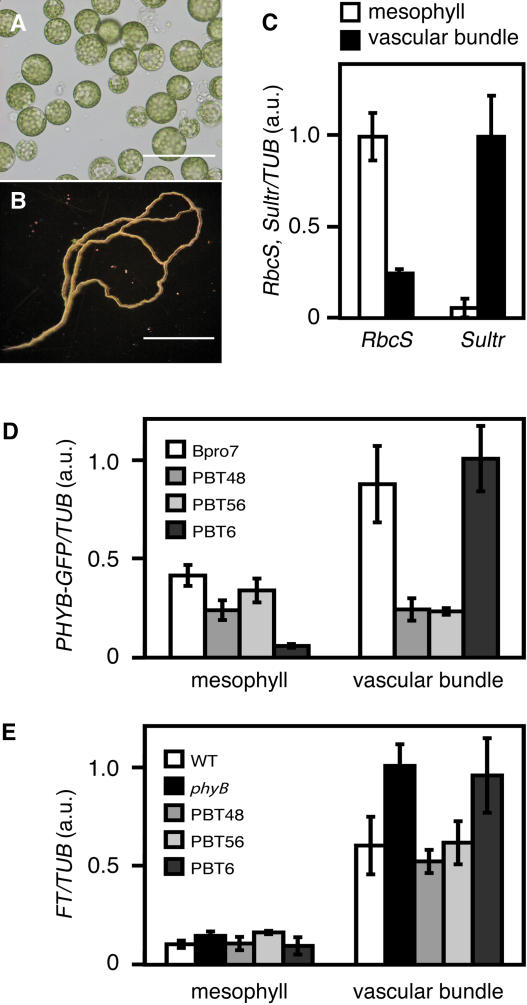
Light is one of the most important environmental factors that determine the timing of a plant's transition from the vegetative to reproductive, or flowering, phase. Not only daylength but also the spectrum of light greatly affect flowering. The shade of nearby vegetation reduces the ratio of red to far-red light and can trigger shade avoidance responses, including stem elongation and the acceleration of flowering. Phytochrome B (phyB) acts as a photoreceptor for this response. Physiological studies have suggested that leaves can perceive and respond to shade. However, little is known about the mechanisms involved in the processing of light signals within leaves. In this study, we used an enhancer-trap system to establish Arabidopsis thaliana transgenic lines that express phyB-green fluorescent protein (GFP) fusion protein in tissue-specific manners. The analysis of these lines demonstrated that phyB-GFP in mesophyll cells affected flowering, whereas phyB-GFP in vascular bundles did not. Furthermore, mesophyll phyB-GFP suppressed the expression of a key flowering regulator, FLOWERING LOCUS T, in the vascular bundles of cotyledons. Hence, a novel intertissue signaling from mesophyll to vascular bundles is revealed as a critical step for the regulation of flowering by phyB.
Figures
Similar articles
-
CRYPTOCHROME2 in vascular bundles regulates flowering in Arabidopsis.Plant Cell. 2007 Jan;19(1):84-93. doi: 10.1105/tpc.106.048157. Epub 2007 Jan 26. Plant Cell. 2007. PMID: 17259260 Free PMC article.
-
The phytochrome-interacting vascular plant one-zinc finger1 and VOZ2 redundantly regulate flowering in Arabidopsis.Plant Cell. 2012 Aug;24(8):3248-63. doi: 10.1105/tpc.112.101915. Epub 2012 Aug 17. Plant Cell. 2012. PMID: 22904146 Free PMC article.
-
Regulation of flowering time by light quality.Nature. 2003 Jun 19;423(6942):881-5. doi: 10.1038/nature01636. Nature. 2003. PMID: 12815435
-
Phytochrome-mediated light signalling in Arabidopsis.Curr Opin Plant Biol. 2004 Oct;7(5):564-9. doi: 10.1016/j.pbi.2004.07.004. Curr Opin Plant Biol. 2004. PMID: 15337099 Review.
-
Nitrate Signaling and Its Role in Regulating Flowering Time in Arabidopsis thaliana.Int J Mol Sci. 2024 May 13;25(10):5310. doi: 10.3390/ijms25105310. Int J Mol Sci. 2024. PMID: 38791350 Free PMC article. Review.
Cited by
-
Transcriptome sequencing and DEG analysis in different developmental stages of floral buds induced by potassium chlorate in Dimocarpus longan.Plant Biotechnol (Tokyo). 2022 Sep 25;39(3):259-272. doi: 10.5511/plantbiotechnology.22.0526a. Plant Biotechnol (Tokyo). 2022. PMID: 36349234 Free PMC article.
-
Research Advances and Perspectives on Early Flowering Traits in Cucumber.Plants (Basel). 2025 Apr 8;14(8):1158. doi: 10.3390/plants14081158. Plants (Basel). 2025. PMID: 40284046 Free PMC article. Review.
-
Molecular mechanisms underlying phytochrome-controlled morphogenesis in plants.Nat Commun. 2019 Nov 19;10(1):5219. doi: 10.1038/s41467-019-13045-0. Nat Commun. 2019. PMID: 31745087 Free PMC article. Review.
-
Effects of rare-earth light conversion film on the growth and fruit quality of sweet pepper in a solar greenhouse.Front Plant Sci. 2022 Sep 6;13:989271. doi: 10.3389/fpls.2022.989271. eCollection 2022. Front Plant Sci. 2022. PMID: 36147241 Free PMC article.
-
Photomorphogenesis.Arabidopsis Book. 2012;10:e0147. doi: 10.1199/tab.0147. Epub 2012 Jan 31. Arabidopsis Book. 2012. PMID: 22582028 Free PMC article.
References
-
- Adam, E., Szell, M., Szekeres, M., Schafer, E., and Nagy, F. (1994). The developmental and tissue specific expression of tobacco phytochrome-A genes. Plant J. 6, 283–293.
-
- An, H., Roussot, C., Suarez-Lopez, P., Corbesier, L., Vincent, C., Pineiro, M., Hepworth, S., Mouradov, A., Justin, S., Turnbull, C., and Coupland, G. (2004). CONSTANS acts in the phloem to regulate a systemic signal that induces photoperiodic flowering of Arabidopsis. Development 131, 3615–3626. - PubMed
-
- Black, M., and Shuttleworth, J.E. (1974). The role of the cotyledons in the photocontrol of hypocotyl extension in Cucumis sativus L. Planta 117, 57–66. - PubMed
-
- Brand, A.H., and Perrimon, N. (1993). Targeted gene expression as a means of altering cell fates and generating dominant phenotypes. Development 118, 401–415. - PubMed
Publication types
MeSH terms
Substances
LinkOut - more resources
Full Text Sources
Other Literature Sources
Molecular Biology Databases
