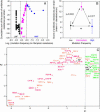
Relationship between antibiotic resistance and mutation frequencies. These data were obtained using a collection of
E. coli natural isolates composed of 76 strains isolated from the urine of patients with spinal cord injuries either as asymptomatic carriage (
n = 32) or as urinary tract infections (
n = 44). The following antibiotics were used: amikacin, AN; amoxicillin, AMX; amoxicillin + clavulanic acid, AMC; aztreonam, ATM; cefalotin, CF; cefamandol, MA; cefepime, FEP; cefotaxime, CTX; cefoxitin, FOX; ceftazidime, CAZ; chloramphenicol, C; ciprofloxacin, CIP; fosfomycin, FOS; gentamicin, GM; imipenem, IPM; kanamycin, K; moxalactam, MOX; nalidixic acid, NA; netilmicin, NET; nitrofurantoin, FT; ofloxacin, OFX; pefloxacin, PEF; piperacillin, PIP; piperacillin + tazobactam, TZP; sulfamethoxazole, SSS; sulfamethoxazole + trimethoprim, SXT; tetracycline, TE; ticarcillin, TIC; ticarcillin + clavulanic acid, TCC; tobramycin, TM; trimethoprim, TMP. Sensitive, intermediate, and resistant phenotypes were scored as 0, 1, and 2, respectively. (A) The curve was obtained by plotting the cumulative sum of the score of antibiotic resistance per strain as the function of the increase of mutation frequencies. The plotted values correspond to

.
M(
xj),
R(
xj), and
R being the mutation frequency, the score of antibiotic resistance of the strain, and the average score of antibiotic resistance in the collection, respectively. A decrease/increase in the plot reveals a succession of strains with a lower- or higher-than-average level of resistance. LMF, low mutation frequency; IMF, intermediate mutation frequency; HMF, high mutation frequency. (B) Three groups of strains having low, intermediate, and high mutation frequencies, with significantly (Mann-Whitney test) different levels of the score of antibiotic resistance per strain were identified using breaking points of the cumulative sum analysis curve in A (dotted lines). (C) Factorial analysis of correspondence. LMF, IMF, and HMF phenotypes were considered as illustrative variables. The levels of sensitivity (sensitive, S; intermediate, I; resistant, R) to each antibiotic were considered as active variables. This plane clearly distinguishes the LMF and HMF strains, grouped with the S phenotype on the positive values of the F1 axis, from the IMF strains with I and R phenotypes on the negative values. This collection has 52.6% of strains resistant to amoxicillin, a well-known indicator of the frequency of antibiotic resistance in bacterial populations. Identical patterns of the relationship between antibiotic resistance and mutation frequencies were obtained with two other collections encompassing both commensal and extra-intestinal pathogenic strains: a collection of 117 highly resistant strains producing extended spectrum β-lactamases (100% of strains resistant to amoxicillin) (B
ranger et al. 2005) and a collection of 119 strains isolated in the 1980s with a low level of antibiotic resistance (11.8% of strains resistant to amoxicillin) (data not shown).