. 2005 Sep;171(1):49-61.
doi: 10.1534/genetics.105.044560. Epub 2005 Jun 18.

High functional overlap between MluI cell-cycle box binding factor and Swi4/6 cell-cycle box binding factor in the G1/S transcriptional program in Saccharomyces cerevisiae

Affiliations

High functional overlap between MluI cell-cycle box binding factor and Swi4/6 cell-cycle box binding factor in the G1/S transcriptional program in Saccharomyces cerevisiae

James M Bean et al. Genetics. 2005 Sep.

Abstract

In budding yeast, many genes are induced early in the cell cycle. Induction of these genes has been predominantly attributed to two transcription factors, Swi4-Swi6 (SBF) and Mbp1-Swi6 (MBF). Swi4 and Mbp1 are related DNA-binding proteins with dissimilar target sequences. For most G1/S-regulated genes that we tested in a cdc20 block-release protocol for cell-cycle synchronization, removal of both Swi4 and Mbp1 was necessary and sufficient to essentially eliminate cell-cycle-regulated expression. Detectable SBF or MBF binding sites (SCBs or MCBs) in the promoters or available genome-wide promoter occupancy data do not consistently explain this functional overlap. The overlapping ability of these transcription factors to regulate many promoters with very similar cell-cycle kinetics may provide robustness to the G1/S transcriptional response, but poses a puzzle with respect to promoter-transcription factor specificity. In addition, for some genes, deletion of Mbp1 or Swi4 enhances transcription, suggesting that these factors can also function as transcriptional repressors. Finally, we observe residual G1/S transcriptional regulation in the absence of Swi4 and Mbp1.


Figures

Figure 1.
Figure 1.
Northern blot analysis of control genes and representative G1/S-regulated genes. Northern blots of total RNA from cdc20 GALL-CDC20-synchronized cultures for each selected gene and the corresponding TCM1 loading control are shown for mbp1 (JB04-15D, blue), swi4 (JB03-19C, red), mbp1 swi4 (JB21-2B, green), and WT (2147-7C or JB13, black) strains over time. Total RNA from unsynchronized cultures is also shown (cyc). Quantitation of expression from each blot is also shown as expression level relative to the peak of expression of the WT control as a function of time from block release. For quantitation, all probes in each strain were normalized using TCM1 probed on the same blot. For the CLB2 and CLB5 genes, no 165- or 180-min time point was collected for any strain and no 135- or 150-min time point was collected for mbp1 or swi4 single deletion strains.
Figure 2.
Figure 2.
Comparison of expression data in mutants, consensus binding sites, and genome-wide binding data. (A) Log2 of the ratio of expression of genes in WT (2147-7C, blue), PCLN3-CLN2 (JB13, purple), and by microarray hybridization (Spellman et al. 1998, orange). Ratios of expression for WT are the averages of two experiments. For each gene, the ratio of expression for WT and PCLN3-CLN2 is defined as Log2(Peak/(σ + Trough)), where the trough value is normalized to the peak value, which is set to one. σ is the error in measurement of the trough value. The ratio of expression for microarray hybridization is the average of the log2 of the expression ratios from four different methods of cell synchronization (Spellman et al. 1998). The ratios of expression of the two control genes (SIC1 and SWI5) are shown on the left. (B) Ratio of expression of genes in mbp1 swi4 (JB21-2B, green), mbp1 (JB03-15D, blue), and swi4 (JB03-19C, red) all relative to WT (2147-7C or JB13). For each gene, the ratio of expression is defined as the difference of peak expression minus trough expression of the mutant divided by the difference of peak expression minus trough expression of the WT control, as determined by Northern blot. A ratio of expression >0.5 is called normal, from 0.25 to 0.5 is called reduced, and below 0.25 is called off. The genes are ordered (for A–D) in decreasing ratio of expression for the mbp1 swi4 double mutant. The ratio of expression of CWP1 in the mbp1 mutant is 8.3 and its bar has been cut off for space. The ratios of expression of the two control genes (SIC1 and SWI5) are shown on the left. (C) The number of MCBs (ACGCG) and SCBs (CRCGAAA) in the intergenic region upstream from each gene is shown. For divergently transcribed genes sharing the same upstream intergenic region, any sites are listed for both genes. The numbers of sites in the promoter regions of the two controls (SIC1 and SWI5) are shown on the left. (D) For each gene, the binding status of MBF and SBF is shown for three genome-wide binding data sets: study A (Iyer et al. 2001), study B (Simon et al. 2001), and study C (Harbison et al. 2004). M (blue) indicates only MBF binding, S (red) indicates only SBF binding, B (green) indicates both MBF and SBF binding, and N (black) indicates neither MBF nor SBF binding. Also shown (bottom row) for each gene is the presence of MBF binding sites and/or SBF binding sites that are conserved across sensu strictu Saccharomyces species according to one data set (Harbison et al. 2004). For this row, M (blue) indicates a conserved MBF binding site, S (red) indicates a conserved SBF binding site, B (green) indicates conserved MBF and SBF binding sites, and N (black) indicates neither conserved MBF nor conserved SBF binding sites. The two control genes (SIC1 and SWI5) are shown on the left.
Figure 3.
Figure 3.
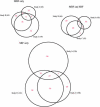
Venn diagrams of the overlap of MBF and SBF binding in three genome-wide binding data sets. Venn diagrams depicting the overlap of MBF-only bound, SBF-only bound, or MBF- and SBF-bound genes in study A (Iyer et al. 2001), study B (Simon et al. 2001), and study C (Harbison et al. 2004) are shown. All the circles representing the size of each of the nine sets (three data sets × three binding states) are drawn to scale; however, due to spatial constraints the overlaps between sets may not be to scale. The number given in parentheses next to each data set name for each binding state is the total number of genes with that binding state found in that data set. The numbers listed in red indicate the number of genes in that particular space. For example, in the MBF-only binding state, 35 (of 46) genes were found by study B (Simon et al. 2001) that were not found by either of the other two data sets and 2 genes were found by study A (Iyer et al. 2001) and study C (Harbison et al. 2004) but not by study B (Simon et al. 2001).
Figure 4.
Figure 4.
Chromatin immunoprecipitations using tagged Swi4 and Mbp1. The results from duplicate experiments are shown. For each promoter tested, the amount of signal from an untagged control (2147-7C), a Swi4-Myc-tagged strain (JB05-1B), and a Mbp1-Myc-tagged strain (JB06-1A) is shown. All strains were cdc20∷LEU2 GALL-CDC20 and were blocked and released for 40 min before harvesting, to enrich cells at the peak time of expression of G1/S-regulated genes. “IP” indicates the signal from the anti-Myc immunoprecipitated enriched pool of DNA. “INPUT” indicates the signal from the whole-cell extracted DNA. For all ChIPs the bands shown are unsaturated and within the linear range of pixel intensities. (A) ChIPs of three G1/S-regulated genes as well as CLN3 used as a control are shown. Also indicated is the presence or absence of MCBs or SCBs in the promoters of the genes tested. Here MCB is defined as ACGCG and SCB as CRCGAAA. Also shown is each gene's dependence on either Mbp1 or Swi4 for normal regulation as determined by Northern blot analysis (see Figure 2). “Swi4/Mbp1” means that removal of both is required to ablate regulation; “Swi4” means that removal of Swi4 is sufficient to ablate control. (B) ChIPs using multiplex PCR with oligos for three G1/S-regulated genes along with oligos for URA3 used as a nonspecific control are shown. Regulation of CLN2 was not fully determined in this study, since we used ectopic CLN2 expression to rescue the mbp1 swi4 strain, precluding analysis of the endogenous gene by Northern blot. Previous data suggest that CLN2 is under partial control of Swi4, consistent with a 70% reduction in peak:trough ratio upon SWI4 deletion in CDC20-synchronized cells in our protocol (data not shown), and also may be under partial control of Mbp1 (Koch et al. 1993; Koch and Nasmyth 1994; Stuart and Wittenberg 1994).

Similar articles

Cited by

References

    1. Althoefer, H., A. Schleiffer, K. Wassmann, A. Nordheim and G. Ammerer, 1995. Mcm1 is required to coordinate G2-specific transcription in Saccharomyces cerevisiae. Mol. Cell. Biol. 15: 5917–5928. - PMC - PubMed
    1. Amon, A., M. Tyers, B. Futcher and K. Nasmyth, 1993. Mechanisms that help the yeast cell cycle clock tick: G2 cyclins transcriptionally activate G2 cyclins and repress G1 cyclins. Cell 74: 993–1007. - PubMed
    1. Andrews, B. J., and I. Herskowitz, 1989. a Identification of a DNA binding factor involved in cell-cycle control of the yeast HO gene. Cell 57: 21–29. - PubMed
    1. Andrews, B. J., and I. Herskowitz, 1989. b The yeast SWI4 protein contains a motif present in developmental regulators and is part of a complex involved in cell-cycle-dependent transcription. Nature 342: 830–833. - PubMed
    1. Breeden, L., and K. Nasmyth, 1987. Cell cycle control of the yeast HO gene: cis- and trans-acting regulators. Cell 48: 389–397. - PubMed

Publication types

MeSH terms