

Approximating identity-by-descent matrices using multiple haplotype configurations on pedigrees
- PMID: 15965257
- PMCID: PMC1456528
- DOI: 10.1534/genetics.104.040337
Approximating identity-by-descent matrices using multiple haplotype configurations on pedigrees
Abstract
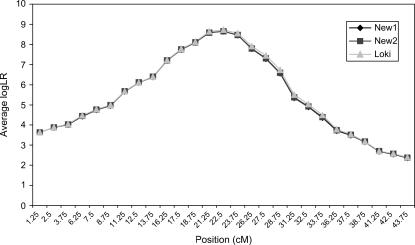
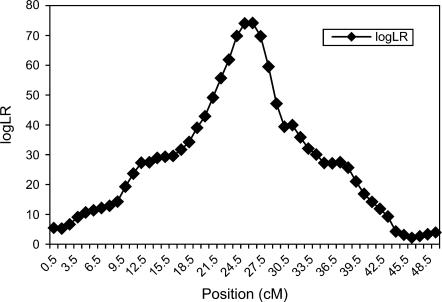
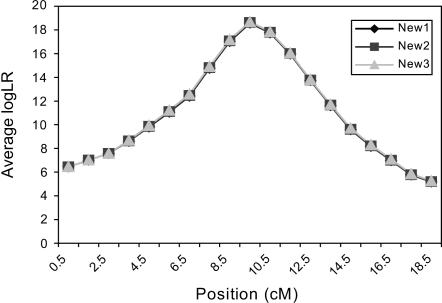
Identity-by-descent (IBD) matrix calculation is an important step in quantitative trait loci (QTL) analysis using variance component models. To calculate IBD matrices efficiently for large pedigrees with large numbers of loci, an approximation method based on the reconstruction of haplotype configurations for the pedigrees is proposed. The method uses a subset of haplotype configurations with high likelihoods identified by a haplotyping method. The new method is compared with a Markov chain Monte Carlo (MCMC) method (Loki) in terms of QTL mapping performance on simulated pedigrees. Both methods yield almost identical results for the estimation of QTL positions and variance parameters, while the new method is much more computationally efficient than the MCMC approach for large pedigrees and large numbers of loci. The proposed method is also compared with an exact method (Merlin) in small simulated pedigrees, where both methods produce nearly identical estimates of position-specific kinship coefficients. The new method can be used for fine mapping with joint linkage disequilibrium and linkage analysis, which improves the power and accuracy of QTL mapping.
Figures

Similar articles
-
Optimal haplotype structure for linkage disequilibrium-based fine mapping of quantitative trait loci using identity by descent.Genetics. 2006 Mar;172(3):1955-65. doi: 10.1534/genetics.105.048686. Epub 2005 Dec 1. Genetics. 2006. PMID: 16322505 Free PMC article.
-
Conditional probability methods for haplotyping in pedigrees.Genetics. 2004 Aug;167(4):2055-65. doi: 10.1534/genetics.103.021055. Genetics. 2004. PMID: 15342540 Free PMC article.
-
HAPLORE: a program for haplotype reconstruction in general pedigrees without recombination.Bioinformatics. 2005 Jan 1;21(1):90-103. doi: 10.1093/bioinformatics/bth388. Epub 2004 Jul 1. Bioinformatics. 2005. PMID: 15231536
-
QTL analysis in arbitrary pedigrees with incomplete marker information.Heredity (Edinb). 2002 Nov;89(5):339-45. doi: 10.1038/sj.hdy.6800136. Heredity (Edinb). 2002. PMID: 12399991 Review.
-
Finding starting points for Markov chain Monte Carlo analysis of genetic data from large and complex pedigrees.Genet Epidemiol. 2003 Jul;25(1):14-24. doi: 10.1002/gepi.10243. Genet Epidemiol. 2003. PMID: 12813723 Review.
Cited by
-
Mixed effects models for quantitative trait loci mapping with inbred strains.Genetics. 2008 Nov;180(3):1743-61. doi: 10.1534/genetics.108.091058. Epub 2008 Sep 14. Genetics. 2008. PMID: 18791243 Free PMC article.
-
Haplotyping methods for pedigrees.Hum Hered. 2009;67(4):248-66. doi: 10.1159/000194978. Epub 2009 Jan 27. Hum Hered. 2009. PMID: 19172084 Free PMC article. Review.
References
-
- Abecasis, G. R, S. S. Cherny, W. O. Cookson and L. R. Cardon, 2002. Merlin-rapid analysis of dense genetic maps using sparse gene flow trees. Nat. Genet. 30: 97–101. - PubMed
-
- Falconer, D. S., and T. F. C. Mackay, 1996. Introduction to Quantitative Genetics. Addison-Wesley Longman, Harlow, England.
-
- Gao, G., and I. Hoeschele, 2005. A note on a conditional enumeration haplotyping method in pedigrees, in Lecture Notes in Bioinformatics. Springer-Verlag, New York (in press).
Publication types
MeSH terms
Grants and funding
LinkOut - more resources
Full Text Sources
Other Literature Sources
