. 2005 Jul;37(7):710-7.
doi: 10.1038/ng1589. Epub 2005 Jun 19.

An integrative genomics approach to infer causal associations between gene expression and disease

Affiliations

An integrative genomics approach to infer causal associations between gene expression and disease

Eric E Schadt et al. Nat Genet. 2005 Jul.

Abstract

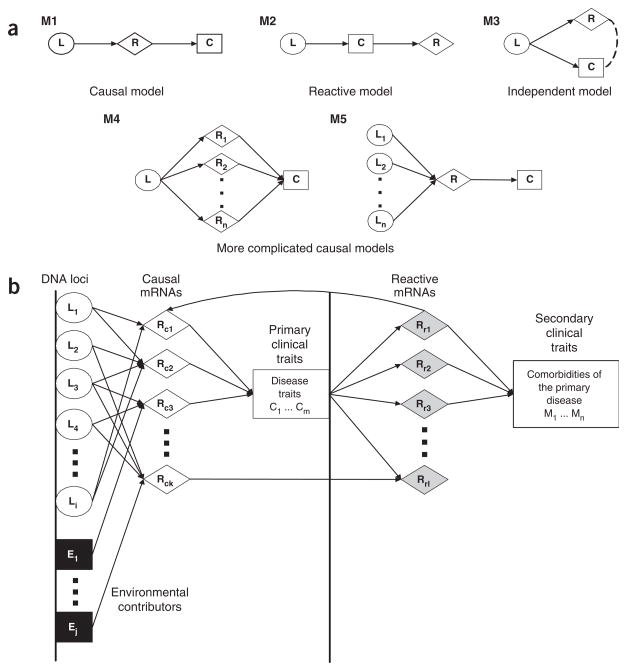
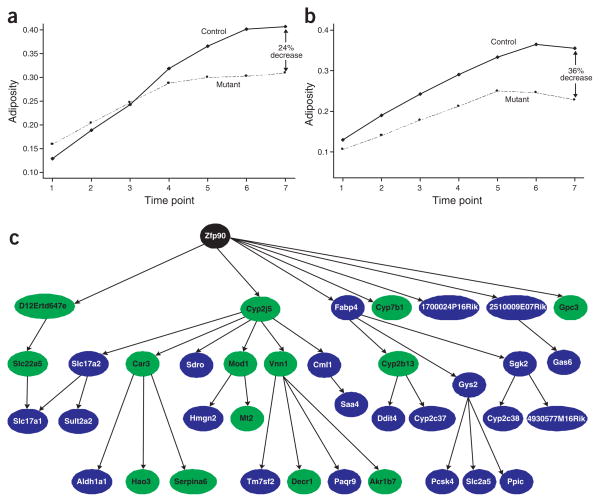
A key goal of biomedical research is to elucidate the complex network of gene interactions underlying complex traits such as common human diseases. Here we detail a multistep procedure for identifying potential key drivers of complex traits that integrates DNA-variation and gene-expression data with other complex trait data in segregating mouse populations. Ordering gene expression traits relative to one another and relative to other complex traits is achieved by systematically testing whether variations in DNA that lead to variations in relative transcript abundances statistically support an independent, causative or reactive function relative to the complex traits under consideration. We show that this approach can predict transcriptional responses to single gene-perturbation experiments using gene-expression data in the context of a segregating mouse population. We also demonstrate the utility of this approach by identifying and experimentally validating the involvement of three new genes in susceptibility to obesity.


Conflict of interest statement

COMPETING INTERESTS STATEMENT

The authors declare that they have no competing financial interests.

Figures

Figure 1
Figure 1
Using QTL data to infer relationships between RNA levels and complex traits. (a) Possible relationships between QTLs, RNA levels and complex traits once the expression of a gene (R) and a complex trait (C) have been shown to be under the control of a common QTL (L). Model M1 is the simplest causal relationship with respect to R, in which L acts on C through transcript R. Model M2 is the simplest reactive model with respect to R, in which R is modulated by C. Model M3 is the independent model, in which the QTL at locus L acts on these traits independently. Model M4 is a more complicated causal diagram in which a QTL at locus L affects the expression of multiple transcripts (R1 through Rn), and these RNAs in turn act on a complex trait C. Finally, model M5 is the ideal causal diagram for target identification, in which multiple QTLs (L1 through Ln) explain a significant amount of the genetic variance in a complex trait C, where the QTLs act on C through a convergence on a single transcript R. (b) Hypothetical gene network for disease traits and related comorbidities. The QTL (Li) and environmental effects (Ej) represent the most upstream drivers of the disease. These components, in turn, influence one set of transcript levels (RCk), which in turn lead to the disease state (measured as disease traits, Cm). Variations in the disease traits affect reactive RNA levels (RRI), which then lead to comorbidities of the disease traits or to positive or negative feedback control to the causal pathways.
Figure 2
Figure 2
Strong gametic phase disequilibrium between genes with significant cis-acting eQTLs simulates independence events. (a) The Ppox and Ifi203 gene expression traits have strong cis-acting eQTLs with lod scores of 29.2 and 17.4, respectively, at the positions indicated. The physical locations of these genes on chromosome 1 are also shown aligned next to the genetic map. (b) Scatter plot of the mean-log (ML) expression ratios for Ppox and Ifi203 in the BXD data set. The two genes are positively correlated, with a correlation coefficient of 0.75. This correlation is probably induced by the two genes having closely linked eQTLs and not a result of any functional relationship. (c) Twenty-one genes physically residing on chromosome 1 were identified with strong cis-acting eQTL (corresponding lod scores > 10.0). Pearson correlation coefficients were computed for the mean log expression ratios between each of the 210 possible pairs of genes. The absolute value of each of the correlations is plotted here against the distance (cM) separating the cis-acting eQTLs for each pair. The pattern in this plot indicates that the magnitude of correlation is directly proportional to the distance between the cis-acting eQTLs, which are coincident with the physical locations of the genes (correlation coefficient = 0.82). This is precisely the relationship we would expect if the correlation structures were attributed to linkage disequilibrium between the eQTLs. The Ppox-Ifi203 pair is highlighted by the red dot.
Figure 3
Figure 3
Use of conditional correlations support Hsd11b1 as causal for OFPM at the chromosome 1 OFPM QTL. The blue curve represents the lod score curve for Hsd11b1; the red curve represents the lod score curve for OFPM; and the black curve represents the lod score curve for Hsd11b1 and OFPM considered simultaneously, indicating that the two traits considered together provide a significant QTL at the chromosome 1 locus. The green line represents the lod score curve for Hsd11b1 after conditioning on OFPM; the orange line represents the lod score curve for OFPM after conditioning on Hsd11b1. Because the lod score effectively drops to 0 in the case of the orange curve and is significantly greater than 0 in the case of the green curve, a causal relationship is supported.
Figure 4
Figure 4
Three genes in the OFPM causality list achieve validation in genetically modified mice. (a,b) Growth curves for C3ar1−/− (a) and Tgfbr2+/− (b; mutant) and control mice over seven time points. Growth is given on the y axis as the fat mass to lean mass ratio. At each time point the mean ratio is plotted for each group. The significance of the mean ratio differences at time point 7 is given in Table 3. (c) Genetic subnetwork for liver expression in the BXD cross previously described highlights Zfp90 (black node) as a central node in the liver transcriptional network of this cross. This subnetwork was obtained from the full liver expression network previously described by identifying all nodes in this network that were descended from and within a path length of 3 of the Zfp90 node. Nodes highlighted in green represent genes testing as causal for fat mass (Supplementary Table 2 online).

Similar articles

Cited by

References

    1. Hughes TR, et al. Functional discovery via a compendium of expression profiles. Cell. 2000;102:109–126. - PubMed
    1. Karp CL, et al. Identification of complement factor 5 as a susceptibility locus for experimental allergic asthma. Nat Immunol. 2000;1:221–226. - PubMed
    1. Schadt EE, et al. Genetics of gene expression surveyed in maize, mouse and man. Nature. 2003;422:297–302. - PubMed
    1. Johnson JM, et al. Genome-wide survey of human alternative pre-mRNA splicing with exon junction microarrays. Science. 2003;302:2141–2144. - PubMed
    1. Schadt EE. A comprehensive transcript index of the human genome generated using microarrays and computational approaches. Genome Biol. 2004;5:R73. - PMC - PubMed

Publication types

MeSH terms