

Modulation of voltage-dependent Ba2+ currents in the guinea-pig gastric antrum by cyclic nucleotide-dependent pathways
- PMID: 15965497
- PMCID: PMC1576245
- DOI: 10.1038/sj.bjp.0706295
Modulation of voltage-dependent Ba2+ currents in the guinea-pig gastric antrum by cyclic nucleotide-dependent pathways
Abstract
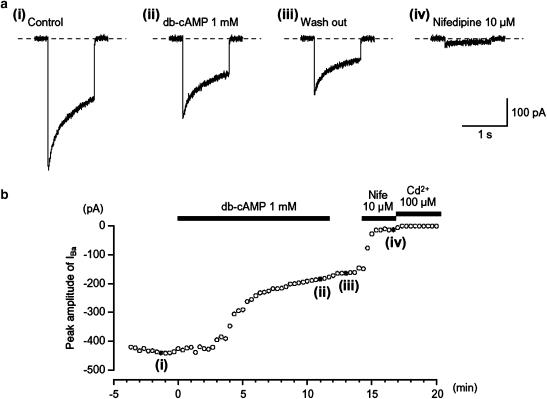
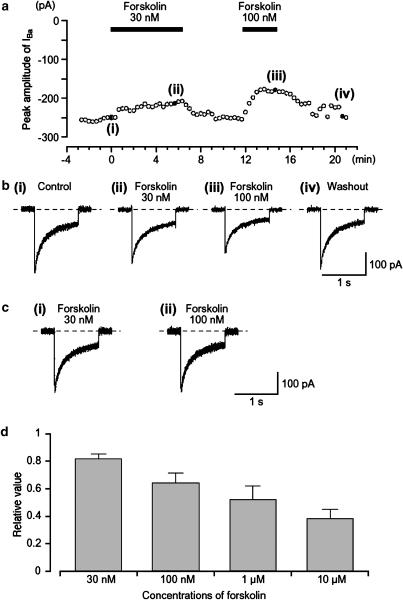
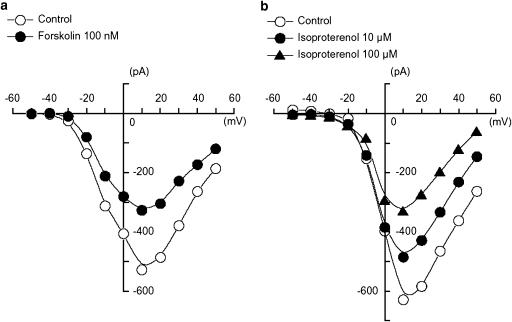
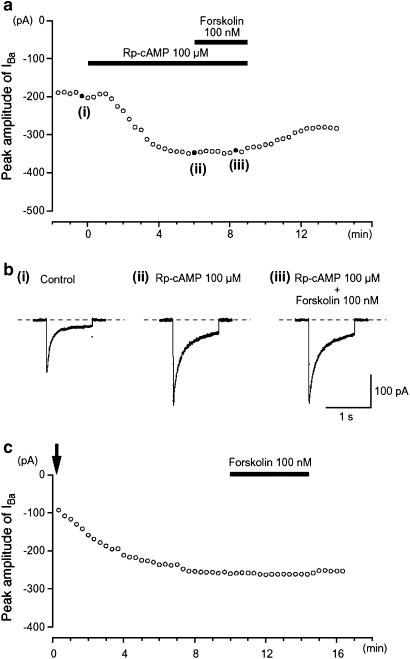
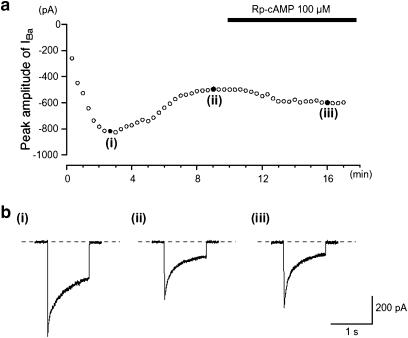
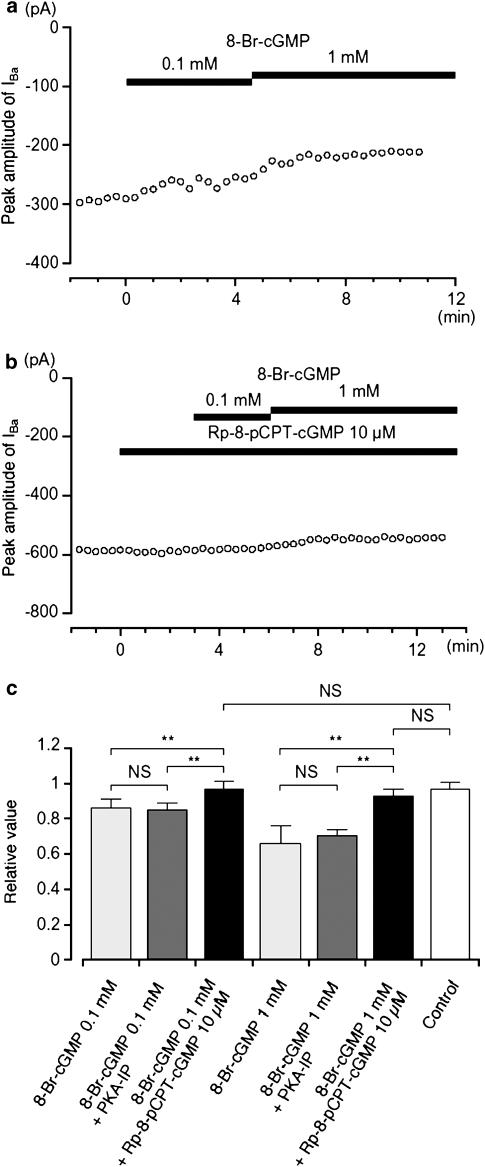
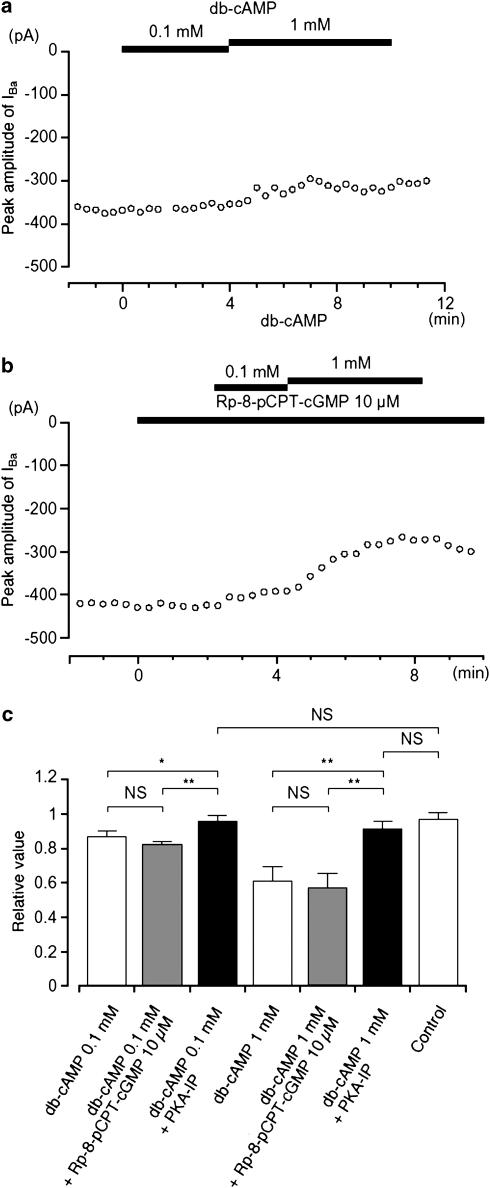
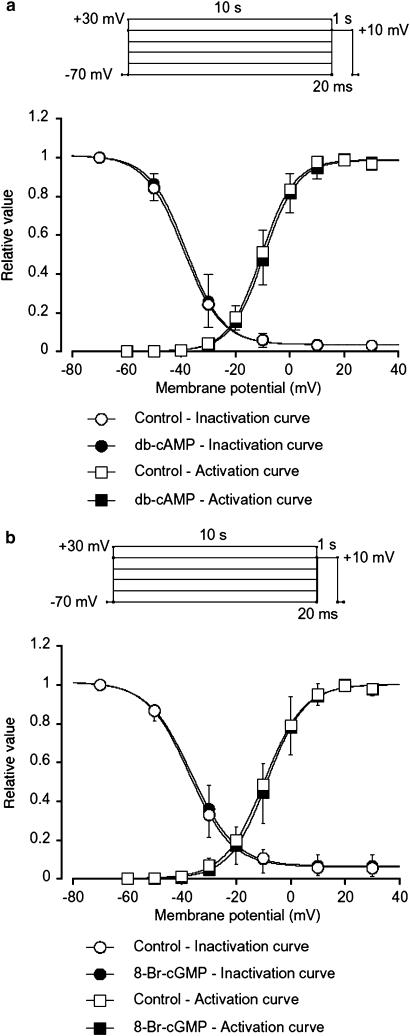
We have investigated whether the activation of cAMP- and cGMP-dependent pathways modifies the properties of voltage-dependent Ba(2+) currents (I(Ba)) recorded from guinea-pig gastric myocytes using patch-clamp techniques. All experiments were carried on single smooth muscle cells, dispersed from the circular layer of the guinea-pig gastric antrum. Both dibutyryl cAMP (db-cAMP, 0.1-1 mM), a membrane-permeable ester of cAMP, and isoproterenol, a selective beta-stimulant, inhibited I(Ba) in a concentration-dependent manner. Forskolin, but not dideoxy-forskolin, an inactive isomer of forskolin, inhibited the peak amplitude of I(Ba). In the presence of either Rp-cAMP or the PKA (cAMP-dependent protein kinase) inhibitor peptide 5-24 (PKA-IP), neither forskolin nor db-cAMP inhibited I(Ba). After establishing a conventional whole-cell recording, the peak amplitude of I(Ba) gradually decreased when the catalytic subunit of PKA was included in the pipette. The further application of Rp-cAMP reversibly enhanced I(Ba). Sodium nitroprusside (0.1-1 mM) and 8-Br-cGMP (0.1-1 mM) also inhibited I(Ba) in a concentration-dependent manner. The inhibitory effects of forskolin or db-cAMP on I(Ba) were not significantly changed by pretreatment with a cGMP-dependent protein kinase (PKG) inhibitor. Similarly, the inhibitory actions of 8-Br-cGMP on I(Ba) were not modified by PKA-IP. The membrane-permeable cyclic nucleotides db-cAMP and 8-Br-cGMP caused little shift of the voltage dependence of the steady-state inactivation and reactivation curves. Neither of the membrane-permeable cyclic nucleotides db-cAMP or 8-Br-cGMP had additive inhibitory effects on I(Ba). These results indicate that two distinct cyclic nucleotide-dependent pathways are present in the guinea-pig gastric antrum, and that both inhibited I(Ba) in an independent manner.
Figures
Similar articles
-
Antagonistic actions of S(-)-Bay K 8644 on cyclic nucleotide-induced inhibition of voltage-dependent Ba(2+) currents in guinea pig gastric antrum.Naunyn Schmiedebergs Arch Pharmacol. 2008 Dec;378(6):609-15. doi: 10.1007/s00210-008-0332-5. Epub 2008 Jul 23. Naunyn Schmiedebergs Arch Pharmacol. 2008. PMID: 18648774
-
Modulation of Ca2+ channels by cyclic nucleotide cross activation of opposing protein kinases in rabbit portal vein.Circ Res. 1998 Mar 23;82(5):557-65. doi: 10.1161/01.res.82.5.557. Circ Res. 1998. PMID: 9529160
-
Inhibitory effect of C-type natriuretic peptide on L-type calcium channel currents in gastric antral myocytes of guinea pigs.Gen Physiol Biophys. 2006 Dec;25(4):365-77. Gen Physiol Biophys. 2006. PMID: 17356230
-
Modulation of the hyperpolarization-activated current (Ih) by cyclic nucleotides in guinea-pig primary afferent neurons.J Physiol. 1996 Apr 1;492 ( Pt 1)(Pt 1):97-106. doi: 10.1113/jphysiol.1996.sp021292. J Physiol. 1996. PMID: 8730586 Free PMC article.
-
Dendroaspis natriuretic peptide relaxes gastric antral circular smooth muscle of guinea-pig through the cGMP/cGMP-dependent protein kinase pathway.World J Gastroenterol. 2008 Sep 21;14(35):5461-6. doi: 10.3748/wjg.14.5461. World J Gastroenterol. 2008. PMID: 18803360 Free PMC article.
Cited by
-
Relaxation patterns of human gastric corporal smooth muscle by cyclic nucleotides producing agents.Korean J Physiol Pharmacol. 2009 Dec;13(6):503-10. doi: 10.4196/kjpp.2009.13.6.503. Epub 2009 Dec 31. Korean J Physiol Pharmacol. 2009. PMID: 20054499 Free PMC article.
-
Molecular and biophysical properties of voltage-gated Na+ channels in murine vas deferens.Biophys J. 2008 Apr 15;94(8):3340-51. doi: 10.1529/biophysj.107.117192. Epub 2008 Jan 11. Biophys J. 2008. PMID: 18192366 Free PMC article.
-
Effects of flavoxate hydrochloride on voltage-dependent Ba2+ currents in human detrusor myocytes at different experimental temperatures.Naunyn Schmiedebergs Arch Pharmacol. 2007 Nov;376(3):195-203. doi: 10.1007/s00210-007-0190-6. Epub 2007 Oct 2. Naunyn Schmiedebergs Arch Pharmacol. 2007. PMID: 17909749
-
Functional role of vasoactive intestinal polypeptide in inhibitory motor innervation in the mouse internal anal sphincter.J Physiol. 2013 Mar 15;591(6):1489-506. doi: 10.1113/jphysiol.2012.247684. Epub 2013 Jan 21. J Physiol. 2013. PMID: 23339175 Free PMC article.
-
Comparison of inhibitory neuromuscular transmission in the Cynomolgus monkey IAS and rectum: special emphasis on differences in purinergic transmission.J Physiol. 2018 Nov;596(22):5319-5341. doi: 10.1113/JP275437. Epub 2018 Oct 13. J Physiol. 2018. PMID: 30198065 Free PMC article.
References
-
- BUNEMANN M., GERHARDSTEIN B.L., GAO T., HOSEY M.M. Functional regulation of L-type calcium channels via protein kinase A-mediated phosphorylation of the β2 subunit. J. Biol. Chem. 1999;274:33851–33854. - PubMed
-
- BÜLBRING E., TOMITA T. Catecholamine action on smooth muscle. Pharmacol. Rev. 1987;39:49–96. - PubMed
-
- DAVILA H.M. Molecular and functional diversity of voltage-gated calcium channels. Ann. NY Acad. Sci. 1999;868:102–117. - PubMed
-
- FARRUGIA G. Ionic conductances in gastrointestinal smooth muscles and interstitial cells of Cajal. Ann. Rev. Physiol. 1999;61:45–84. - PubMed
-
- FURNESS J.B., COSTA M. The Enteric Nervous System. Edinburgh: Churchill-Livingstone; 1987.
Publication types
MeSH terms
Substances
LinkOut - more resources
Full Text Sources
Miscellaneous
