. 2005 Jul;115(7):1765-76.
doi: 10.1172/JCI24543. Epub 2005 Jun 16.

Claudin-1 regulates cellular transformation and metastatic behavior in colon cancer

Affiliations

Claudin-1 regulates cellular transformation and metastatic behavior in colon cancer

Punita Dhawan et al. J Clin Invest. 2005 Jul.

Abstract

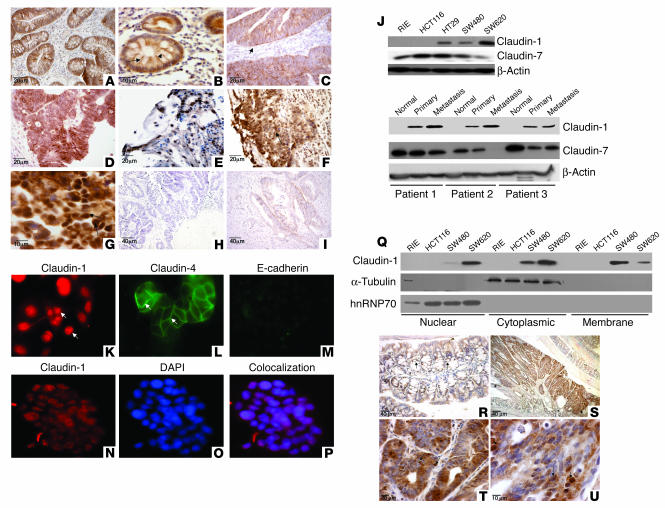
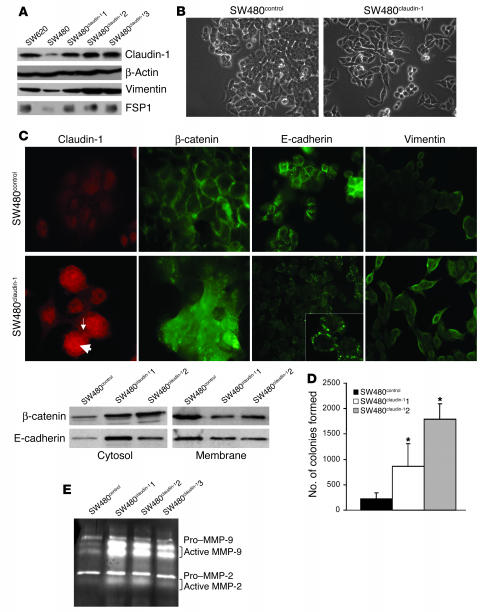
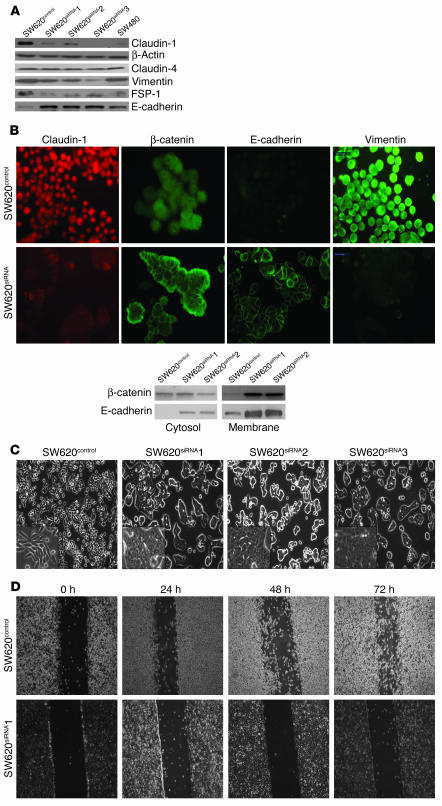
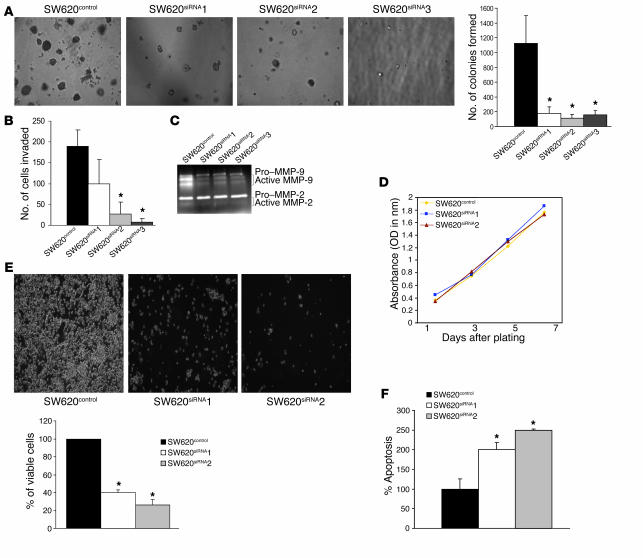
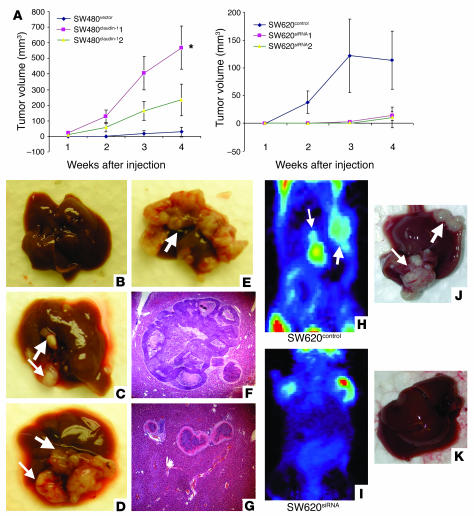
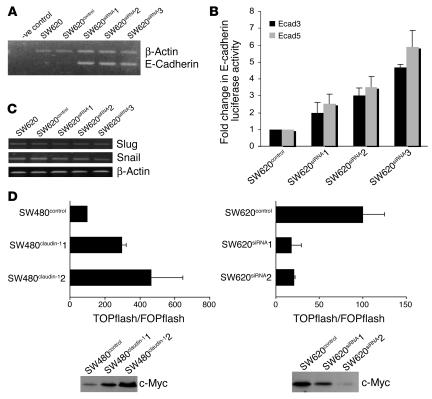
Disruption of the cell-cell junction with concomitant changes in the expression of junctional proteins is a hallmark of cancer cell invasion and metastasis. The role of adherent junction proteins has been studied extensively in cancer, but the roles of tight junction (TJ) proteins are less well understood. Claudins are recently identified members of the tetraspanin family of proteins, which are integral to the structure and function of TJs. Recent studies show changes in expression/cellular localization of claudins during tumorigenesis; however, a causal relationship between claudin expression/localization and cancer has not been established. Here, we report an increased expression of claudin-1 in human primary colon carcinoma and metastasis and in cell lines derived from primary and metastatic tumors. We also report frequent nuclear localization of claudin-1 in these samples. Genetic manipulations of claudin-1 expression in colon cancer cell lines induced changes in cellular phenotype, with structural and functional changes in markers of epithelial-mesenchymal transition. Furthermore, we demonstrate that changes in claudin-1 expression have significant effects on growth of xenografted tumors and metastasis in athymic mice. We further provide data suggesting that the regulation of E-cadherin expression and beta-catenin/Tcf signaling is a possible mechanism underlying claudin-1-dependent changes.


Figures

Figure 1
Figure 1
Claudin-1 expression increases in colon carcinoma and metastasis. (AI) Paraffin-embedded sections of matched normal, colonic tumor, and metastatic tissues samples from the same patients were examined for claudin-1 expression and subcellular localization by immunohistochemistry using a polyclonal rabbit anti–claudin-1 antibody. (A and B) Representative normal colon tissue. Arrows indicate membranous staining. (CE) Primary human colon adenocarcinoma tissues. Claudin-1 immunoreactivity was visible in the cytoplasm and cell nucleus (arrows). (F and G) Colon adenocarcinoma metastatic to the liver. Claudin-1 nuclear localization is shown by the arrows. (H) Tumor showing no immunoreactivity for claudin-1. (I) No staining was observed in a control experiment without primary antibody. (J) Claudin-1 expression in cell lines and human tissue samples. Equal amounts of total protein (25 μg) from various cell lines (upper panel) or tissues extracts (matched normal primary and metastasis samples; lower panel) were immunoblotted with claudin-1, claudin-7, or actin antibody. (KP) Immunofluorescence localization of claudin-1, claudin-4, and E-cadherin in metastatic SW620 cells. (KM) Claudin-1 (red) was predominantly localized in cell nucleus (arrows), whereas claudin-4 was largely localized on cell membrane (green; arrows). (NP) Colocalization of claudin-1 (red) with DAPI (blue) is confirmed by overlay (purple). (Q) Cytoplasmic, nuclear, and membrane-specific fractions were prepared as described in Methods. Equal amounts of protein from all fractions were subjected to Western blot analysis using claudin-1 antibody. (RU) Claudin-1 expression in intestinal epithelium and adenoma in ApcMin/+ mice. By immunohistochemical analysis, claudin-1 is detected in the mucosa primarily in the membrane (arrows) and in the adenoma mainly in the cytoplasm and nucleus (SU) in ApcMin/+ mice.
Figure 2
Figure 2
Overexpression of claudin-1 in the primary colon adenocarcinoma cell line SW480 cells induces further dedifferentiation. (A) Immunoblot analysis for the expression of claudin-1, vimentin, and FSP1 in SW620, SW480control, and SW480claudin-1 cells. The expression of these proteins was similar in SW480 and SW480control cells. Actin was used as a control for protein loading. (B) Representative phase-contrast images of SW480control and SW480claudin-1 cells growing in monolayer cultures. (C) The upper panel represents immunofluorescence localization of claudin-1, E-cadherin, β−catenin, and vimentin in SW480control or SW480claudin-1 cells. Arrows show the nuclear (thick arrow) and membrane (thin arrow) expression of overexpressed claudin-1. The lower panel represents the cytosol and membrane localization of β-catenin and E-cadherin in SW480control and SW480claudin-1 cells. (D) Results of soft agar assay. Colonies were counted from 3 individual plates for each sample, and SW480claudin-1 or SW480control cells were photographed 2 weeks after plating. The number of soft agar colonies presented is the mean of colony counts from 3 different experiments. *P < 0.05 compared to control. (E) Gelatin zymography for determination of MMP-2 and MMP-9 activity. Experiments were performed as described in Methods. MMP-2 and MMP-9 activity was increased in SW480claudin-1 cells compared with SW480control cells.
Figure 3
Figure 3
Effects of siRNA-based inhibition of claudin-1 expression in the metastatic SW620 cells. (A) Western blot analysis of SW620 cells stably expressing claudin-1 siRNA (SW620siRNA). Equal amounts of total protein were subjected to immunoblot analysis using anti–claudin-1 antibody. The clones shown were selected based on similar levels of inhibition of claudin-1 expressions. The same lysates were also subjected to immunoblot analysis for claudin-4 to determine the specificity of the siRNA oligonucleotide. Immunoblotting for vimentin, FSP1, and E-cadherin was performed using the same lysates. (B) The upper panel represents immunofluorescence localization of claudin-1, β-catenin, E-cadherin, and vimentin in SW620siRNA cells. Only SW620control cells are shown, as there were no visible differences between SW620control cells and parental SW620 cells. The lower panel represents results of immunoblot analysis using cytosolic and membrane-specific fractions for expressions of β-catenin and E-cadherin in SW620control and SW620siRNA cells. (C) Representative phase-contrast images of monolayer cultures of SW620control, and SW620siRNA cells. (D) Representative photomicrographs of cell migration by monolayer wound-healing assay using SW620control and SW620siRNA clones. Photomicrographs were obtained 0, 24, 48, and 72 hours after standard scrape wounding, as described in Methods.
Figure 4
Figure 4
Effects of siRNA-based inhibition of claudin-1 expression in SW620 cells on proliferation, anchorage-independent growth, and invasion. (A) Results of soft agar assay. Experiments were performed as described in Methods. The number of soft agar colonies presented is the mean of colony counts from 3 different experiments. (B) A cell invasion assay was performed using 24-well transwells coated with collagen type I (100 μg/ml). After 72 hours of plating, cells from the top of the filter were removed, and the cells that invaded the coated membrane were fixed and counted. Data are presented as mean colony counts in ten ×20 microscopic fields from duplicate wells. *P < 0.05, as compared to control. (C) Gelatin zymography to determine the activities of MMP-2 and MMP-9 in SW620control cells and in all 3 SW620siRNA clones was performed as described in the Methods. (D) Cellular proliferation was measured in SW620control and SW620siRNA cells using MTT assay at 1, 3, 5, and 7 days after plating equal number of cells. (E) The anoikis assay was performed by plating the SW620control and SW620siRNA cells on polyHEMA-coated culture dishes for 72 hours as described in Methods. Values for control cells were considered 100%, and any differences are expressed relative to that value. Each bar represents the mean ± SD of 3 experiments. (F) The anoikis-induced apoptosis was quantitated using apoptosis-specific ELISA. Values for control cells were considered 100%, and any changes were compared with that value. Each bar represents the mean ± SD of 3 experiments.
Figure 5
Figure 5
Effect of modulation of claudin-1 expression on tumor xenograft and liver metastasis in vivo. (A) Flank tumor xenografts after subcutaneous injection (n = 5 mice per group) were monitored for SW480control or 2 individual SW480claudin-1 clones in nude mice (*P < 0.005 and P = 0.063 for each clone compared with the control group). Conversely, cells expressing either SW620control or 2 individual SW620siRNA clones in nude mice were used (P = 0.27 and P = 0.26). The P value was determined using unpaired Student’s t test. (BG) Liver metastasis. Representative metastatic tumors in livers from SW480control (B) and SW480claudin-1 cells (CE) from experiments on nude mice, with corresponding H&E sections indicating intrahepatic tumors (F and G), are shown. (F) Microscopic examination of the liver tumors confirmed that they represented metastases. (G) Intrahepatic vascular spread was noted. (HK) SW620 parental or SW620control cells or 3 individual SW620siRNA clones were injected in nude mice. Seven weeks after inoculation, metastatic tumors were detected in the livers of nude mice by microPET (H and I) and upon necroscopy (J and K). MicroPET imaging was used to screen for nonpalpable lesions in the liver, using 100–150 μCi of 18F-deoxyglucose (18FDG) injected i.p to detect metabolically active foci in the abdomen. The arrows point to the metastatic nodules in the liver. The P value was determined using 2-sided test of proportion.
Figure 6
Figure 6
Effect of inhibition of claudin-1 on E-cadherin expression and β-catenin/Tcf/Lef activity. (A) Endogenous levels of E-cadherin mRNA were measured by semiquantitative RT-PCR using total RNA from SW620 parental or SW620control cells or 3 individual clones of SW620siRNA cells as described in Methods. Primers for actin were used as internal control in the same reaction. -ve control, without reverse transcriptase. (B) The luciferase reporter activity under the control of human E-cadherin promoter construct was measured in the SW620control and SW620siRNA cells. Each bar represents the mean ± SD of 3 experiments. (C) The endogenous levels of Snail and Slug mRNA measured by semiquantitative RT-PCR using RNA from SW620 parental, SW620control, and SW620siRNA cells. Primers for actin were used as a control. (D) SW480control and SW480claudin-1 or SW620control and SW620siRNA cells were transiently cotransfected with TOPflash or FOPflash reporter constructs and SV40–β-galactosidase as internal control (upper panel). Tcf-mediated gene transcription was determined by the ratio of pTOPflash to pFOPflash luciferase activity. Transfections were done in triplicate, and each bar represents the mean ± SD of 3 experiments. Immunoblot analysis of c-Myc in SW480claudin-1 and SW620siRNA cells compared with their respective control cells (lower panel).

References

    1. Marques FR, Fonsechi-Carvasan GA, De Angelo Andrade LAL, Bottcher-Luiz F. Immunohistochemical patterns for alpha- and beta-catenin, E- and N-cadherin expression in ovarian epithelial tumors. Gynecol. Oncol. 2004;94:16–24. - PubMed
    1. Nelson WJ, Nusse R. Convergence of Wnt, beta-catenin, and cadherin pathways. Science. 2004;303:1483–1487. - PMC - PubMed
    1. Al-Aynati MM, Radulovich N, Riddell RH, Tsao M-S. Epithelial-cadherin and beta-catenin expression changes in pancreatic intraepithelial neoplasia. Clin. Cancer Res. 2004;10:1235–1240. - PubMed
    1. Conacci-Sorrell M, et al. Autoregulation of E-cadherin expression by cadherin-cadherin interactions: the roles of beta-catenin signaling, Slug, and MAPK. J. Cell Biol. 2003;163:847–857. - PMC - PubMed
    1. Moon RT, Bowerman B, Boutros M, Perrimon N. The promise and perils of Wnt signaling through beta-catenin [review] Science. 2002;296:1644–1646. - PubMed

Publication types

MeSH terms