. 2005 Jul;3(7):e225.
doi: 10.1371/journal.pbio.0030225. Epub 2005 Jun 28.

The cell cycle-regulated genes of Schizosaccharomyces pombe

Affiliations

The cell cycle-regulated genes of Schizosaccharomyces pombe

Anna Oliva et al. PLoS Biol. 2005 Jul.

Abstract

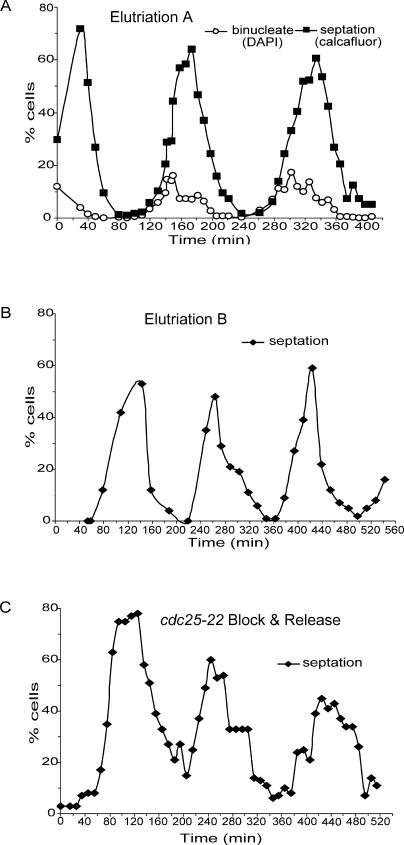
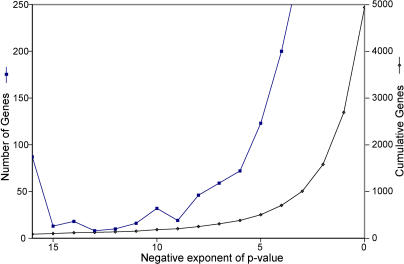
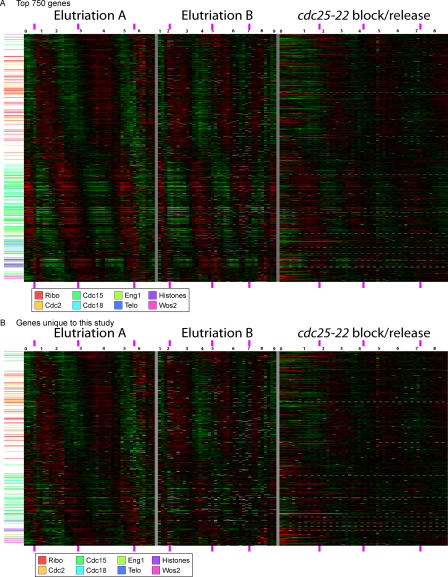
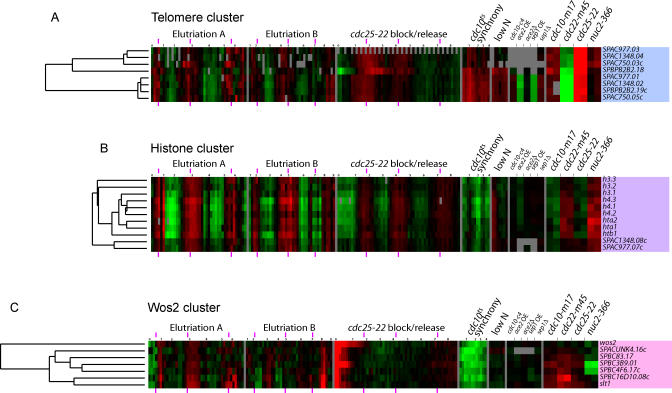
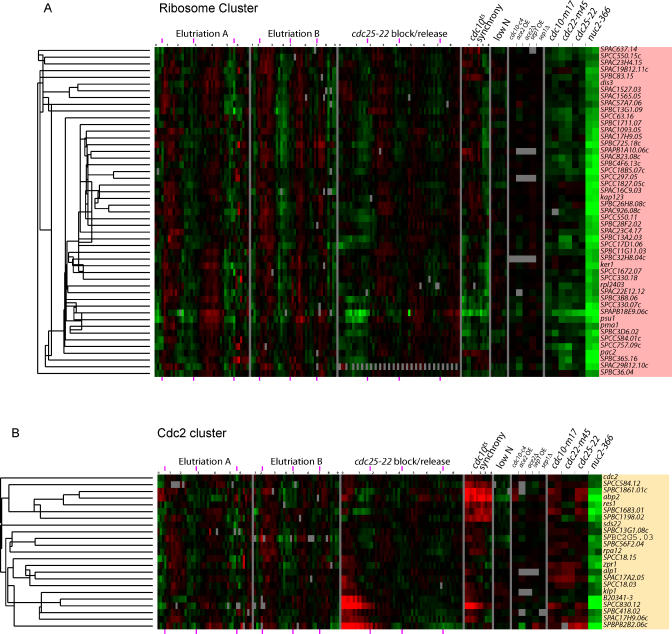
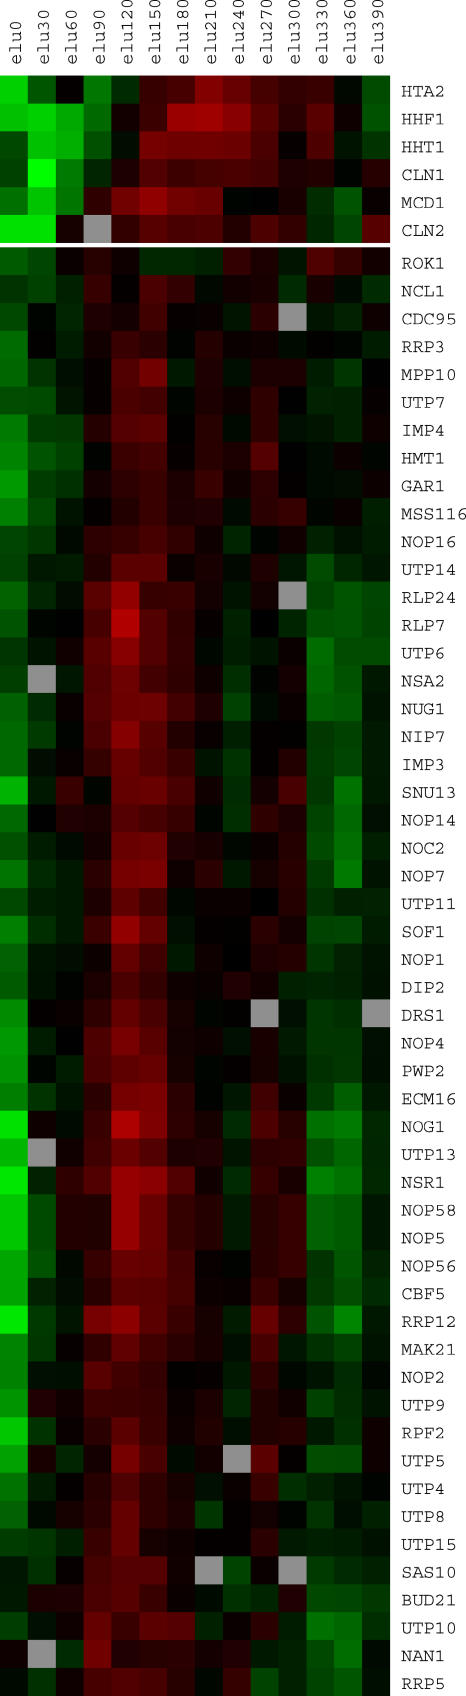
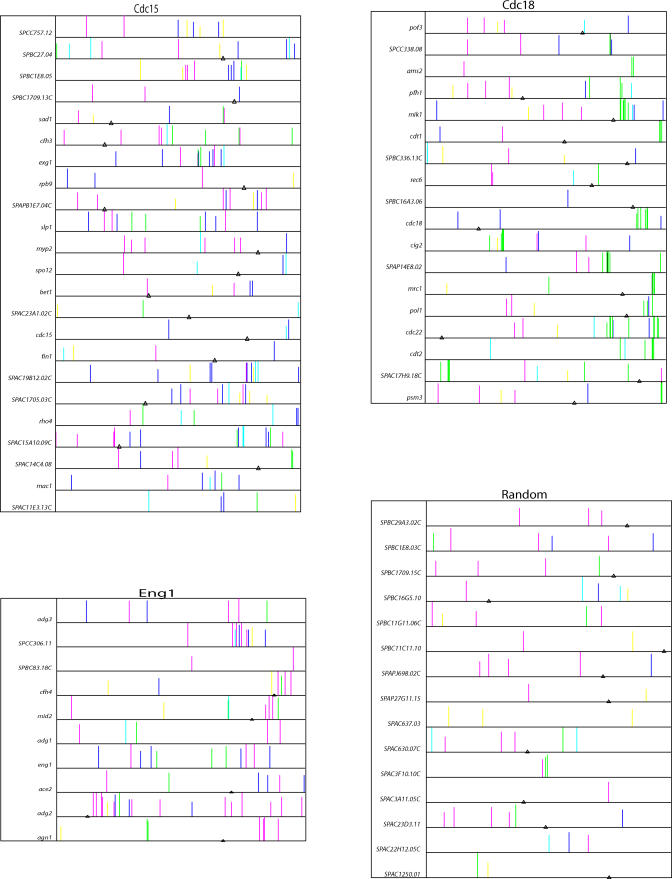
Many genes are regulated as an innate part of the eukaryotic cell cycle, and a complex transcriptional network helps enable the cyclic behavior of dividing cells. This transcriptional network has been studied in Saccharomyces cerevisiae (budding yeast) and elsewhere. To provide more perspective on these regulatory mechanisms, we have used microarrays to measure gene expression through the cell cycle of Schizosaccharomyces pombe (fission yeast). The 750 genes with the most significant oscillations were identified and analyzed. There were two broad waves of cell cycle transcription, one in early/mid G2 phase, and the other near the G2/M transition. The early/mid G2 wave included many genes involved in ribosome biogenesis, possibly explaining the cell cycle oscillation in protein synthesis in S. pombe. The G2/M wave included at least three distinctly regulated clusters of genes: one large cluster including mitosis, mitotic exit, and cell separation functions, one small cluster dedicated to DNA replication, and another small cluster dedicated to cytokinesis and division. S. pombe cell cycle genes have relatively long, complex promoters containing groups of multiple DNA sequence motifs, often of two, three, or more different kinds. Many of the genes, transcription factors, and regulatory mechanisms are conserved between S. pombe and S. cerevisiae. Finally, we found preliminary evidence for a nearly genome-wide oscillation in gene expression: 2,000 or more genes undergo slight oscillations in expression as a function of the cell cycle, although whether this is adaptive, or incidental to other events in the cell, such as chromatin condensation, we do not know.


Figures

Figure 1
Figure 1. Synchrony
(A) Samples from elutriation A were double stained with calcofluor (for septa) and DAPI (for nuclei). Cells were assayed for initiation of anaphase by scoring cells with two nuclei but no septum (binucleates, open circles). The cells were also scored for septation (filled squares). (B) Cells from elutriation B were assayed for septation by phase contrast microscopy. (C) Cells from the cdc25–22 block release were assayed for septation by phase contrast microscopy.
Figure 2
Figure 2. Distribution of p-Values for Cell Cycle–Regulated Genes
The x-axis shows bins of p-values of the significance of cell cycle regulation. From the left, the bins are as follows: (1) Genes with p-values less than 10−16 (87 genes); (2) Genes with p-values between 10−15 and 10−16 (13 genes); (3) Genes with p-values between 10−14 and 10−15 (13 genes); (4) Genes with p-values between 10−13 and 10−14 (eight genes); etc. The number of genes in each bin is shown on the left y-axis (dark blue squares). Also shown (right y-axis, magenta diamonds) is the cumulative number of genes at each p-value or lower. Thus there are about 1,000 genes with a p-value of 10−3 or less.
Figure 3
Figure 3. Cell Cycle–Regulated Genes Ordered by Time of Peak Expression
(A) Expression data for the top 750 genes is shown, with genes ordered by time of peak expression. Every row represents a gene; every column represents an array from a time-course experiment. Red signifies up-regulation (i.e., an experiment/control ratio greater than one); green signifies down-regulation (i.e., an experiment/control ratio less than one). Black is a ratio close to one, and grey is missing data. Dynamic range is 16-fold from reddest red to greenest green. The time in hours since the beginning of the time course is shown in black numerals at the top of Figure 3. The peaks in septation index are marked with purple rectangles at the top and bottom of the figure. Genes from defined clusters are marked on the left by colored lines, according to the cluster color code shown at the bottom of the figure. (B) As (A), but only the 514 genes found in our study but not found by Rustici et al. [7] are shown.
Figure 4
Figure 4. Overlap between Cell Cycle Microarray Studies, by Number of Genes
A Venn diagram of the overlap between the three lists of cell cycle–regulated genes from this study, Rustici et al. [7], and Peng et al. [8]. The number of genes in each of the three lists is 750, 407, and 747, respectively. A few genes are not accounted for because of ambiguities in nomenclature.
Figure 5
Figure 5. Overlap between Different Cell Cycle Microarray Studies, by Rank
(A) Our ranked list of cell cycle–regulated genes is divided into consecutive sets, or bins, of 50 genes. For each set of 50 genes, the number of genes in that set also found in the list of 407 cell cycle genes of Rustici et al. [7] is plotted on the left y-axis. For instance, of our best 50 genes, 44 (88%) are found in the list of of 407 genes of Rustici et al., and of our next-best 50 genes, 38 (76%) are also in their list. For the top 15 bins (750 genes), every bin of 50 genes is represented. Afterward, the number plotted represents an average over several bins. The cumulative number of genes in the list of 407 is plotted on the right y-axis. (B) As (A), but the bins in our study are compared to the list of 747 genes of Peng et al. [8]. (C) As (A), but the ranked list of Peng et al. is divided into bins, and compared to the list of 407 of Rustici et al. Because Peng et al. ranked only their top 2,700 genes, the graph is truncated after gene 2,700, and the cumulative number of genes rises to only 325.
Figure 6
Figure 6. The Number of Genes Peaking during Each Portion of the Cell Cycle
The cell cycle was divided into 45 consecutive portions, or bins. If the cell cycle is considered as a circle of 360°, then each bin occupies 8°. Every gene was analyzed using a Fourier transform to determine the time of peak expression in elutriation A, from 0° to 360°. The number of genes peaking in each bin was summed and plotted (grey bars, background), with the number of genes in each bin shown on the y-axis. Genes in specific clusters are shown by colored bars (foreground). The Fourier transform calculation was similarly used to derive the time of peak septation and peak binucleate cells (from Figure 1) and these cell cycle landmarks are indicated. (A) The top 750 cell cycle–regulated genes were analyzed for time of peak expression. Genes from different clusters are “stacked” when they occur in the same bin. (B) All genes (∼5,000) were analyzed for time of peak expression, exactly as in (A). (C) The bottom 4,000 genes were analyzed for time of peak expression. Data was extracted from arrays before the red/green normalization step, so that the bottom 4,000 genes would not be affected by the normalization and the cyclic expression of the top 750 genes. (D) All genes (∼5,000) were analyzed for time of peak expression after genewise random shuffling of microarray observations. This randomization serves as a negative control for the Fourier calculation in parts (A), (B), and (C).
Figure 7
Figure 7. Cluster Analysis of the Top 750 Cell Cycle–Regulated Genes
Gene expression data from all experiments were clustered by a hierarchical method (Eisen et al. [10]). Every row represents a gene; every column represents an array. Red signifies up-regulation (i.e., an experiment/control ratio greater than one); green signifies down-regulation (i.e., an experiment/control ratio less than one). Black is a ratio close to one, and grey is missing data. Dynamic range is 16-fold from reddest red to greenest green. The time in hours since the beginning of time-course experiments is shown in black numerals at the top of the Figure. Peaks in septation index are marked with purple rectangles at the top and bottom of the Figure. Clusters discussed in the text are marked with blocks of color. Data for the cdc10-C4 (asynchronous cells with the hyperactive allele cdc10-C4), ace2 OE (asynchronous cells over-expressing ace2), ace2Δ (asynchronous ace2Δ cells), sep1 OE (asynchronous cells over-expressing sep1), and sep1Δ (asynchronous sep1Δ cells) are taken from Rustici et al. [7]. cdc10 encodes a component of the MBF transcription factor; ace2 encodes the Ace2 transcription factor, and sep1 encodes a forkhead transcription factor. Other experiments are described in Materials and Methods.
Figure 8
Figure 8. M Phase Clusters
Clusters of apparently co-regulated genes were chosen from Figure 7. See legend to Figure 7 for further information. (A) Cdc15 cluster, (B) Cdc18 cluster, and (C) Eng1 cluster.
Figure 9
Figure 9. S/Early G2 Clusters
(A) Telomeric cluster, (B) Histone cluster, and (C) Wos2 cluster.
Figure 10
Figure 10. Early to Mid G2 Clusters
(A) Ribosome biogenesis cluster and (B) Cdc2 cluster.
Figure 11
Figure 11. Oscillation of Ribosome Biogenesis Genes in S. cerevisiae
One cell cycle of elutriation data is shown for 52 S. cerevisiae genes involved in ribosome biogenesis. The genes chosen for analysis were those listed [42,75] as involved in ribosome biogenesis. At the top of Figure 11 are three histone genes (HTA2, HHF1, and HHT10) known to peak in S, and three genes (CLN1, CLN2, and MCD1) known to peak in late G1. The raw data for this figure are taken from Spellman et al. [6]. In their experiment, cells were grown in ethanol medium, and then small G1 cells were isolated by elutriation and re-inoculated into ethanol medium. Samples were taken at intervals from 0 to 390 min, the duration of one cell cycle under these conditions.
Figure 12
Figure 12. Distribution of Promoter Motifs
A total of 23 genes from the core of the Cdc15 cluster (cdc15), the 18 genes from the Cdc18 cluster (cdc18), the nine genes from the Eng1 cluster, plus one similarly regulated gene (SPBC83.18c; eng1) and 15 randomly chosen genes (Random) had their promoters examined for six sequence motifs using SpikeChart. For each gene, the DNA sequence examined was the 2,000 bp immediately upstream of the Start codon; the Start codon is at the right edge of the figure, and the upstream 2,000 bp extend to the left. The beginning of the next upstream open reading frame is indicated by a triangle; for instance, for the pof3 gene (Cdc18 cluster), the next open reading frame begins about 700 bp upstream of the pof3 Start codon. For the Cdc18 cluster gene ams2, all 2,000 bp are intergenic. Consensus motifs are as follows: Dark Blue Fkh motif, TGTAAACAAA; Purple Ace2 motif, ACCAGCCT; Green MBF motif, GACGCGTC; Black Dbl10 motif, ACGCGACGCG; Light Blue/Aquamarine New 1v motif, TGACAAC; Yellow New 3v motif, (A/T)ACC(A/T)CG(T/C)(A/T)(C/A)C. Taller spikes indicate a better match to the consensus; the weight matrices, and the rules governing spike height, are given in Table S2. Dbl10 spikes (black) are obscured by overlapping MBF spikes (green), and so are hard to see. Only tall spikes (i.e., good matches to the consensus) are shown, so an acceptable motif may exist even when no spike is shown,

References

    1. Nurse P, Thuriaux P, Nasmyth K. Genetic control of the cell division cycle in the fission yeast Schizosaccharomyces pombe . Mol Gen Genet. 1976;146:167–178. - PubMed
    1. Culotti J, Hartwell LH. Genetic control of the cell division cycle in yeast. 3. Seven genes controlling nuclear division. Exp Cell Res. 1971;67:389–401. - PubMed
    1. Hartwell LH, Culotti J, Reid B. Genetic control of the cell-division cycle in yeast. I. Detection of mutants. Proc Nat Acad Sci U S A. 1970;66:352–359. - PMC - PubMed
    1. Hartwell LH. Genetic control of the cell division cycle in yeast. II. Genes controlling DNA replication and its initiation. J Mol Biol. 1971;59:183–194. - PubMed
    1. Hartwell LH. Genetic control of the cell division cycle in yeast. IV. Genes controlling bud emergence and cytokinesis. Exp Cell Res. 1971;69:265–276. - PubMed

Publication types

MeSH terms