The bacterial chemotactic response reflects a compromise between transient and steady-state behavior
- PMID: 15967993
- PMCID: PMC1166586
- DOI: 10.1073/pnas.0407659102
The bacterial chemotactic response reflects a compromise between transient and steady-state behavior
Abstract
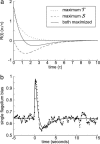
Swimming bacteria detect chemical gradients by performing temporal comparisons of recent measurements of chemical concentration. These comparisons are described quantitatively by the chemotactic response function, which we expect to optimize chemotactic behavioral performance. We identify two independent chemotactic performance criteria: In the short run, a favorable response function should move bacteria up chemoattractant gradients; in the long run, bacteria should aggregate at peaks of chemoattractant concentration. Surprisingly, these two criteria conflict, so that when one performance criterion is most favorable, the other is unfavorable. Because both types of behavior are biologically relevant, we include both behaviors in a composite optimization that yields a response function that closely resembles experimental measurements. Our work suggests that the bacterial chemotactic response function can be derived from simple behavioral considerations and sheds light on how the response function contributes to chemotactic performance.
Figures


Similar articles
-
Interplay of chemotaxis and chemokinesis mechanisms in bacterial dynamics.Phys Rev E Stat Nonlin Soft Matter Phys. 2003 Aug;68(2 Pt 1):021925. doi: 10.1103/PhysRevE.68.021925. Epub 2003 Aug 29. Phys Rev E Stat Nonlin Soft Matter Phys. 2003. PMID: 14525024
-
Cell balance equation for chemotactic bacteria with a biphasic tumbling frequency.J Math Biol. 2003 Dec;47(6):518-46. doi: 10.1007/s00285-003-0216-8. Epub 2003 Jun 12. J Math Biol. 2003. PMID: 14618378
-
Steady-state chemotaxis in Escherichia coli.Phys Rev Lett. 2008 Jun 13;100(23):238101. doi: 10.1103/PhysRevLett.100.238101. Epub 2008 Jun 12. Phys Rev Lett. 2008. PMID: 18643546
-
Emergent properties of bacterial chemotaxis pathway.Curr Opin Microbiol. 2017 Oct;39:24-33. doi: 10.1016/j.mib.2017.07.004. Epub 2017 Aug 17. Curr Opin Microbiol. 2017. PMID: 28822274 Review.
-
Diversity in bacterial chemotactic responses and niche adaptation.Adv Appl Microbiol. 2009;66:53-75. doi: 10.1016/S0065-2164(08)00803-4. Adv Appl Microbiol. 2009. PMID: 19203648 Review.
Cited by
-
Bacterial strategies for chemotaxis response.Proc Natl Acad Sci U S A. 2010 Jan 26;107(4):1391-6. doi: 10.1073/pnas.0909673107. Epub 2010 Jan 4. Proc Natl Acad Sci U S A. 2010. PMID: 20080704 Free PMC article.
-
Comparative genomic evidence for a close relationship between the dimorphic prosthecate bacteria Hyphomonas neptunium and Caulobacter crescentus.J Bacteriol. 2006 Oct;188(19):6841-50. doi: 10.1128/JB.00111-06. J Bacteriol. 2006. PMID: 16980487 Free PMC article.
-
Feedback between motion and sensation provides nonlinear boost in run-and-tumble navigation.PLoS Comput Biol. 2017 Mar 6;13(3):e1005429. doi: 10.1371/journal.pcbi.1005429. eCollection 2017 Mar. PLoS Comput Biol. 2017. PMID: 28264023 Free PMC article.
-
Microswimmers learning chemotaxis with genetic algorithms.Proc Natl Acad Sci U S A. 2021 May 11;118(19):e2019683118. doi: 10.1073/pnas.2019683118. Proc Natl Acad Sci U S A. 2021. PMID: 33947812 Free PMC article.
-
Adaptability of non-genetic diversity in bacterial chemotaxis.Elife. 2014 Oct 3;3:e03526. doi: 10.7554/eLife.03526. Elife. 2014. PMID: 25279698 Free PMC article.
References
-
- Berg, H. C. & Brown, D. (1972) Nature 239, 500-504. - PubMed
-
- Larsen, S. H., Reader, R. W., Kort, E. N., Tso, W. & Adler, J. (1974) Nature 249, 74-77. - PubMed
-
- Macnab, R. M. & Ornston, M. K. (1977) J. Mol. Biol. 112, 1-30. - PubMed
-
- Stock, J. B., Lukat, G. S. & Stock, A. M. (1991) Rev. Biophys. Chem. 20, 109-136. - PubMed
Publication types
MeSH terms
Substances
LinkOut - more resources
Full Text Sources

