. 2005 Jul;54(1):79-86.
doi: 10.1002/mrm.20565.

Uncovering of intracellular water in cultured cells

Affiliations

Uncovering of intracellular water in cultured cells

Jean-Philippe Galons et al. Magn Reson Med. 2005 Jul.

Abstract

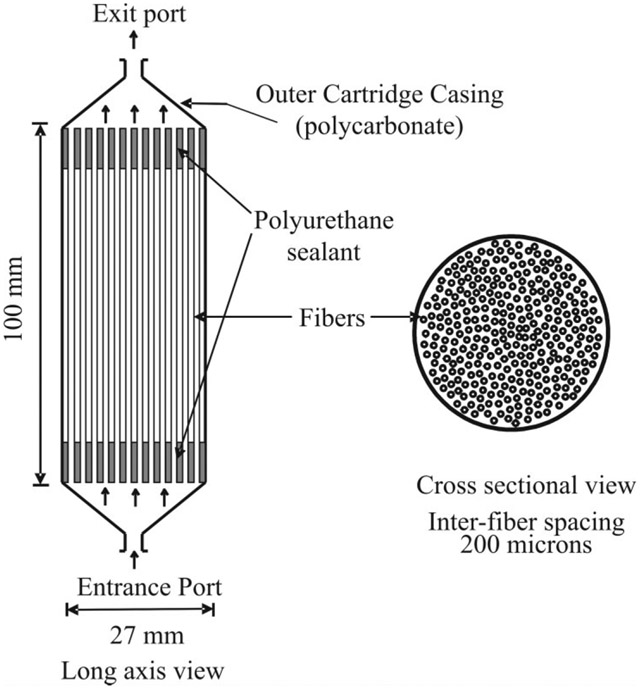
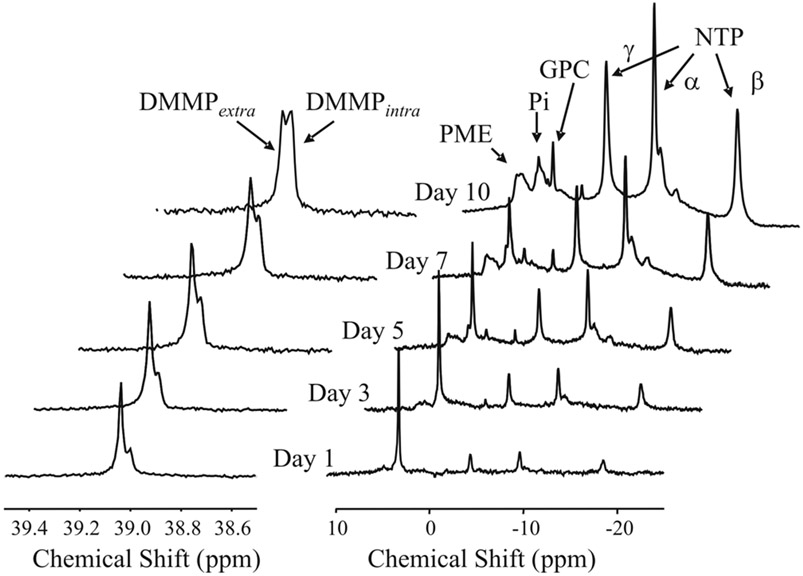
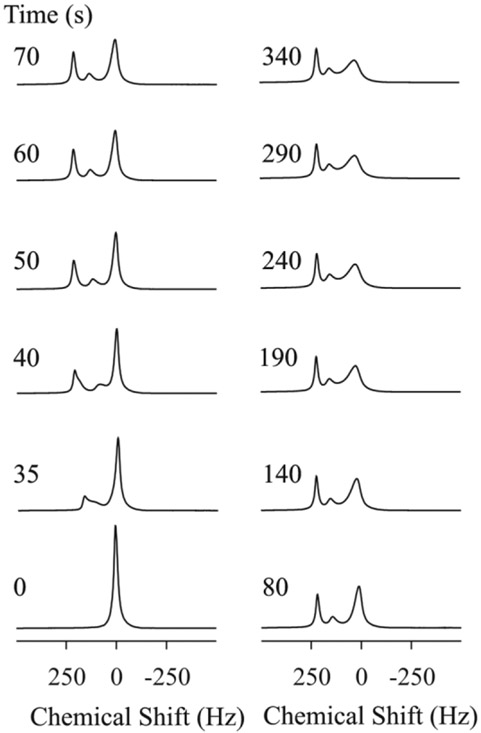
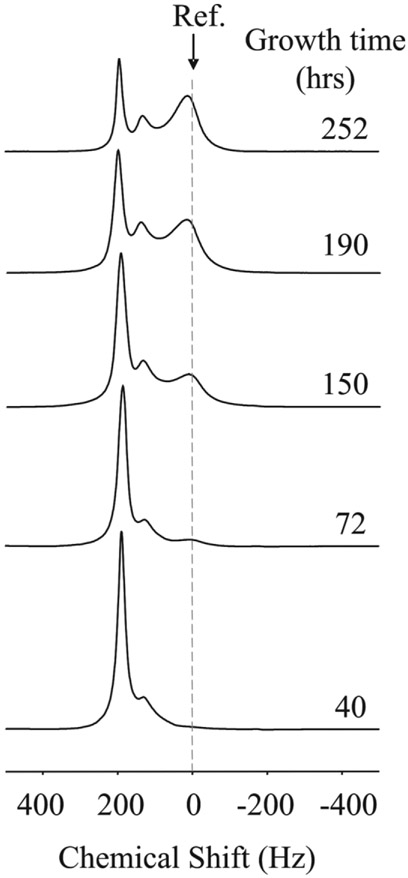
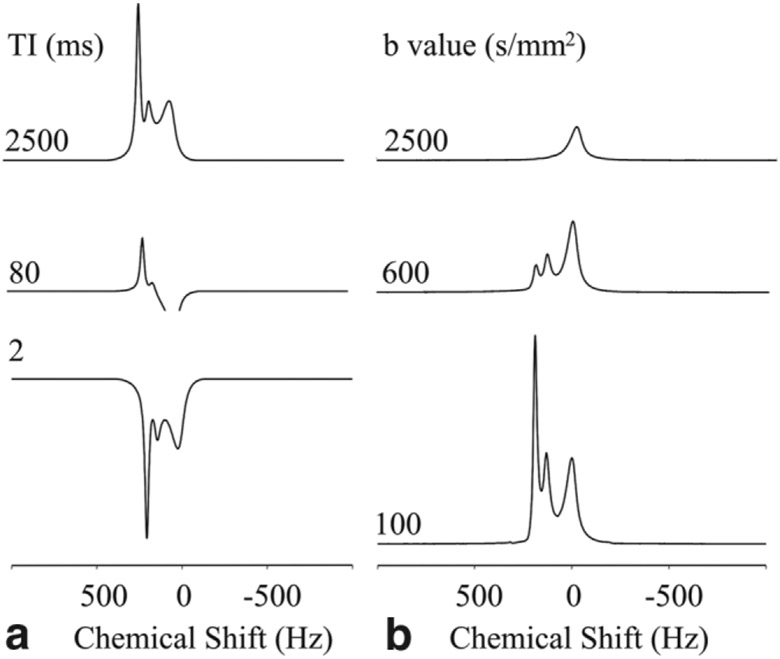
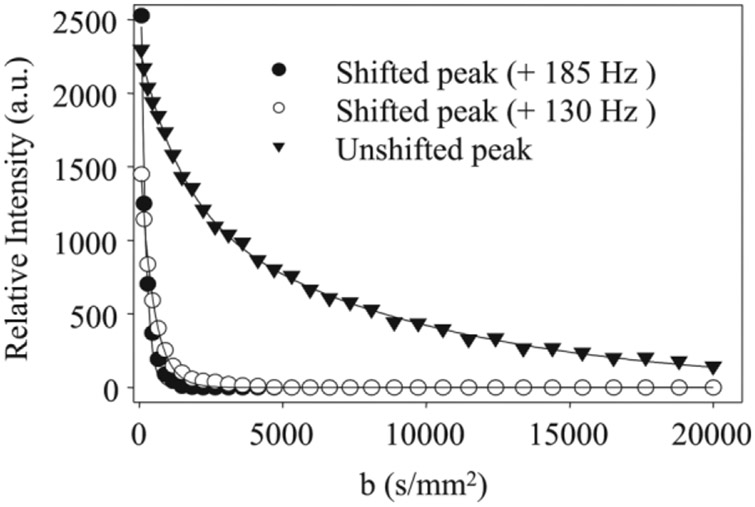
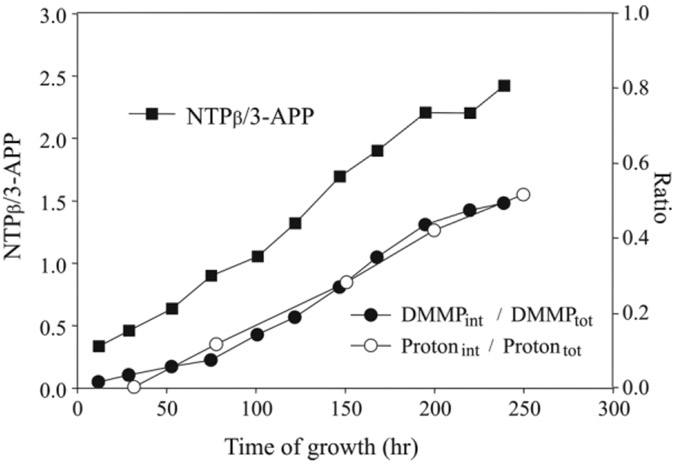
The complexity of biologic tissues, with multiple compartments each with its own diffusion and relaxation properties, requires complex formalisms to model water signal in most magnetic resonance imaging or magnetic resonance spectroscopy experiments. In this article, we describe a magnetic susceptibility-induced shift in the resonance frequency of extracellular water by the introduction of a gadolinium contrast agent to medium perfusing a hollow fiber bioreactor. The frequency shift of the extracellular water (+185 Hz at 9.4 T) uncovers the intracellular water and allows direct measurement of motional and relaxation properties of the intracellular space. The proposed method provides a unique tool for understanding the mechanisms underlining diffusion and relaxation in the intracellular space.


Figures

FIG. 1.
FIG. 1.
The hollow fiber bioreactor (HFBR). The HFBR consists of a 27-mm polyurethane casing containing approximately 450 0.5-mm-ID highly porous fibers. The perfusate consisting of DMME supplemented with 10% FBS serum is pumped through the fibers at a flow rate of 150 mL/min. Cells grow outside the fibers. The various compartments of a bioreactor are as follows: (1) the fiber lumen where the medium is flowing, (2), the fiber walls, highly porous, and (3) the extrafiber space that contains both intracellular and extracellular (nonflowing) spaces whose ratio is a function of cell growth.
FIG. 2.
FIG. 2.
Cell growth as monitored by 31P MRS. The 1H-decoupled spectra of DMMP seen on the left were obtained immediately following the acquisition of the 31P NMR spectra shown on the right. DMMP, dimethylmethylphosphonate; GPC, glycerophosphorylcholine; NTP, nucleoside triphosphates; Pi, inorganic phosphate; PME, phosphomonoesters.
FIG. 3.
FIG. 3.
Cross-sectional diffusion-weighted images at high b-values (5000 s/mm2) at different heights in the bioreactor and at different growth periods. The intensity in the images arises from diffusionally restricted water and represents cell growth.
FIG. 4.
FIG. 4.
Kinetics of Gd-DTPA infusion by 1H MRS at day 11. At 0 sec, the perfusate is switched to a 5 mM Gd-DTPA-containing medium. At a 3 mL/min flow rate the Gd-DTPA containing medium reaches the bioreactor in ~35 s. The total exchange of medium within the bioreactor extrafiber space is completed within 5 min.
FIG. 5.
FIG. 5.
1H spectrum in the presence of 5 mM Gd-DTPA at various stages of growth. The magnitude of the unshifted signal increases with growth, while the magnitude of the leftmost peak decreases. Ref: Signal position prior the 5 mM Gd-DTPA injection.
FIG. 6.
FIG. 6.
Representative spectra from (a) inversion recovery and (b) diffusion-weighted experiments in the presence of Gd-DTPA obtained at day 11 of the experiment.
FIG. 7.
FIG. 7.
Diffusion-weighted signal decays of water signals in presence 5 mM Gd-DTPA. The data were obtained at day 11 of the experiment using a diffusion time of 30 ms. The unshifted (intracellular) water resonance (▼) showed nonmonoexponential behavior. The solid line (—) represents a biexponential fit to the data with the following parameters: S(b) = Vf1ebADC1 + Vf2ebADC2 with Vf1 = 0.44, ADC1 = 0.71 μm2/ms, Vf2 = 0.56, and ADC2 = 0.11 μm2/ms. The shifted peaks +185 Hz (●) and +130 Hz (○) showed monoexponential behavior with measured ADCs of 3.7 ± 0.8 and 2.9 ± 0.3 μm2/ms, respectively.
FIG. 8.
FIG. 8.
Cell growth and volume cell fractions as a function of time. Cell growth was determined by the increase in the ratio of β-NTP signal (normalized to the external standard, 3-APP) over time (■, left side scale). The cell volume fractions derived from the 1H spectrum in presence of Gd-DTPA (○, right side scale), are defined as the ratio of the unshifted signal to shifted signals The cell volume fractions derived from the 31P spectrum of DMMP (●, right side scale) are defined as the ratio of the upfield signal (extracellular) to downfield signals (intracellular).

References

    1. Hsu EW, Aiken NR, Blackband SJ. Nuclear magnetic resonance microscopy of single neurons under hypotonic perturbation. Am J Physiol 1996;271:C1895–C1900. - PubMed
    1. Gillies RJ, Raghunand N, Karczmar GS, Bhujwalla ZM. MRI of the tumor microenvironment.[erratum appears in J Magn Reson Imaging 2002 Dec;16(6):751]. J Magn Reson Imaging 2002;16:430–450. - PubMed
    1. Moseley M, Cohen Y, Mintorovitch J, Chileuitt L, Shimizu H, Kucharczyk J, Wendland M, Weinstein PR. Early detection of regional cerebral ischemia in cats: comparison of diffusion- and T2-weighted MRI and spectroscopy. Magn Reson Med 1990;14:330–346. - PubMed
    1. Kauppinen RA. Monitoring cytotoxic tumour treatment response by diffusion magnetic resonance imaging and proton spectroscopy. NMR Biomed 2002;15:6–17. - PubMed
    1. van Gelderen P, de Vleeschouwer MH, DesPres D, Pekar J, van Zijl PC, Moonen CT. Water diffusion and acute stroke. Magn Reson Med 1994; 31:154–163. - PubMed

Publication types

MeSH terms