

Bioavailability and antioxidant effects of orange juice components in humans
- PMID: 15969493
- PMCID: PMC2533031
- DOI: 10.1021/jf050054y
Bioavailability and antioxidant effects of orange juice components in humans
Abstract
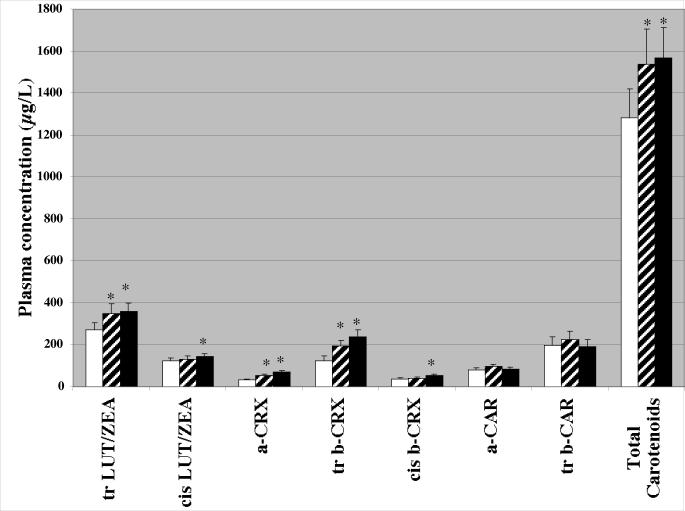
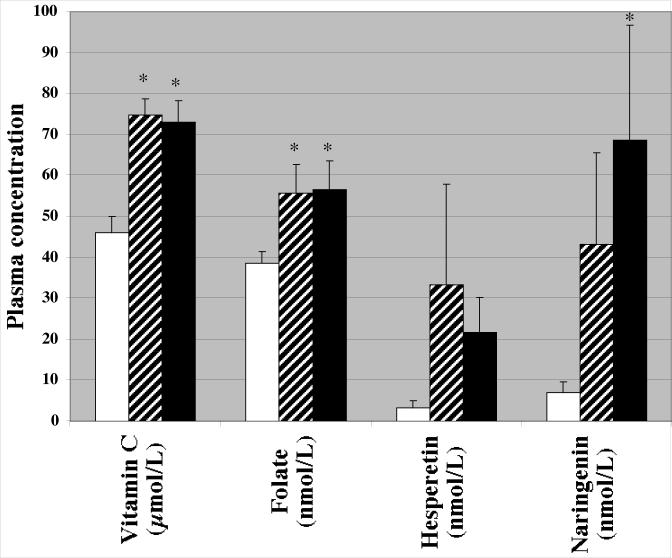
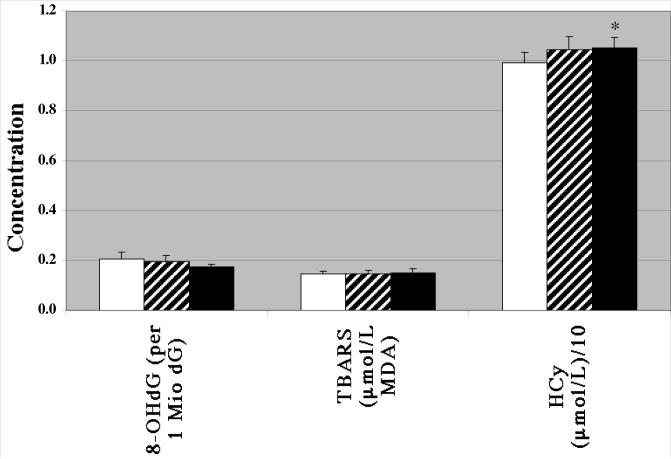
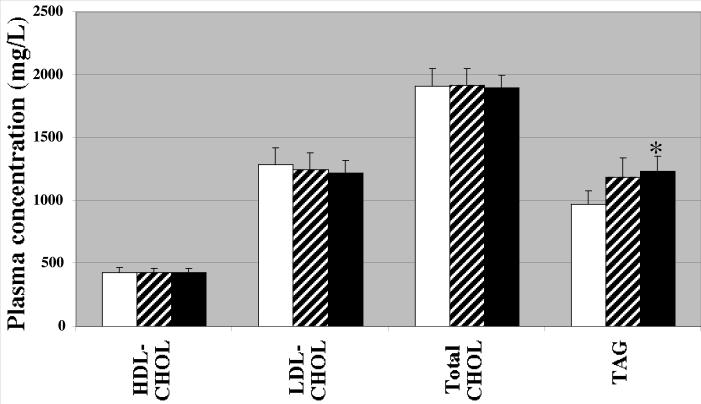
Seven healthy females and six males consumed daily 256 mg of vitamin C, 271 mg of flavanones (mainly as glycosides), 6 mg of carotenoids (mainly xanthophylls and cryptoxanthins), and 0.16 mg of folate by incorporation of daily three times 236 mL of not from concentrate orange juice (OJ) into their habitual diet. At the end of 3 weeks, mean vitamin C, folate, carotenoid, and flavanone plasma concentrations increased significantly relative to baseline by 59% (p < 0.001), 46% (p = 0.018), and 22% (p < 0.001), and 8-fold (p = 0.045), respectively. Flavanones were excreted in urine 9-fold more at the end of the intervention (p = 0.01) but returned to baseline 2 days after study completion. After the 3 week intervention, plasma concentrations of vitamins A and E did not change. 8-Hydroxydeoxyguanosine in white blood cells declined by 16% (p = 0.38; n = 11), and in individuals with high baseline concentrations by 29% (p = 0.36; n = 7), respectively. Low-density lipoprotein (LDL)-/high-density lipoprotein (HDL)-cholesterol ratios decreased but cholesterol (HDL, LDL, total) and thiobarbituric acid reactive substance plasma concentrations did not change significantly. We conclude from this pilot study that OJ is an excellent food source to enhance circulating concentrations of valuable hydrophilic as well as lipophilic phytochemicals.
Figures
Similar articles
-
Concentration and solubility of flavanones in orange beverages affect their bioavailability in humans.J Agric Food Chem. 2010 May 26;58(10):6516-24. doi: 10.1021/jf100752j. J Agric Food Chem. 2010. PMID: 20441150
-
Impact of high pressure and pulsed electric fields on bioactive compounds and antioxidant activity of orange juice in comparison with traditional thermal processing.J Agric Food Chem. 2005 Jun 1;53(11):4403-9. doi: 10.1021/jf048839b. J Agric Food Chem. 2005. PMID: 15913302
-
HDL-cholesterol-raising effect of orange juice in subjects with hypercholesterolemia.Am J Clin Nutr. 2000 Nov;72(5):1095-100. doi: 10.1093/ajcn/72.5.1095. Am J Clin Nutr. 2000. PMID: 11063434 Clinical Trial.
-
Effects of Citrus Fruit Juices and Their Bioactive Components on Inflammation and Immunity: A Narrative Review.Front Immunol. 2021 Jun 24;12:712608. doi: 10.3389/fimmu.2021.712608. eCollection 2021. Front Immunol. 2021. PMID: 34249019 Free PMC article. Review.
-
Tomatoes and cardiovascular health.Crit Rev Food Sci Nutr. 2003;43(1):1-18. doi: 10.1080/10408690390826437. Crit Rev Food Sci Nutr. 2003. PMID: 12587984 Review.
Cited by
-
Orange juice as dietary source of antioxidants for patients with hepatitis C under antiviral therapy.Food Nutr Res. 2017 Mar 22;61(1):1296675. doi: 10.1080/16546628.2017.1296675. eCollection 2017. Food Nutr Res. 2017. PMID: 28469541 Free PMC article.
-
Anti-inflammatory properties of orange juice: possible favorable molecular and metabolic effects.Plant Foods Hum Nutr. 2013 Mar;68(1):1-10. doi: 10.1007/s11130-013-0343-3. Plant Foods Hum Nutr. 2013. PMID: 23417730 Review.
-
Adherence to cancer prevention recommendations and antioxidant and inflammatory status in premenopausal women.Br J Nutr. 2015 Jul 14;114(1):134-43. doi: 10.1017/S0007114515001658. Epub 2015 Jun 8. Br J Nutr. 2015. PMID: 26051510 Free PMC article. Clinical Trial.
-
Impact of orange juice consumption on macronutrient and energy intakes and body composition in the US population.Public Health Nutr. 2012 Dec;15(12):2220-7. doi: 10.1017/S1368980012000742. Epub 2012 Mar 20. Public Health Nutr. 2012. PMID: 22433835 Free PMC article.
-
Long-Term Effect on Bioactive Components and Antioxidant Activity of Thermal and High-Pressure Pasteurization of Orange Juice.Molecules. 2018 Oct 20;23(10):2706. doi: 10.3390/molecules23102706. Molecules. 2018. PMID: 30347848 Free PMC article.
References
-
- Cheeseman KH, Slater TF. An Introduction to Free Radical Biochemistry. Brit. Med. Bull. 1993;49:481–493. - PubMed
-
- Berliner JA, Heinecke JW. The role of oxidized lipoproteins in atherogenesis. Free Radic. Biol. Med. 1996;20:707–727. - PubMed
-
- Bakker SJ, IJzerman RG, Teerlink T, Westerhoff HV, Gans RO, Heine RJ. Cytosolic triglycerides and oxidative stress in central obesity: the missing link between excessive atherosclerosis, endothelial dysfunction, and beta-cell failure? Atherosclerosis. 2000;148:17–21. - PubMed
-
- Coppack SW. Pro-inflammatory cytokines and adipose tissue. Proc. Nutr. Soc. 2001;60:349–356. - PubMed
-
- Fenster CP, Weinsier RL, Darley-Usmar VM, Patel RP. Obesity, aerobic exercise, and vascular disease: the role of oxidant stress. Obes. Res. 2002;10:964–968. - PubMed
Publication types
MeSH terms
Substances
Grants and funding
LinkOut - more resources
Full Text Sources
Other Literature Sources
Medical
