Comparative Study
. 2005 Jun 21:6:42.
doi: 10.1186/1471-2202-6-42.

Difference in trafficking of brain-derived neurotrophic factor between axons and dendrites of cortical neurons, revealed by live-cell imaging

Affiliations
Comparative Study

Difference in trafficking of brain-derived neurotrophic factor between axons and dendrites of cortical neurons, revealed by live-cell imaging

Naoki Adachi et al. BMC Neurosci. .

Abstract

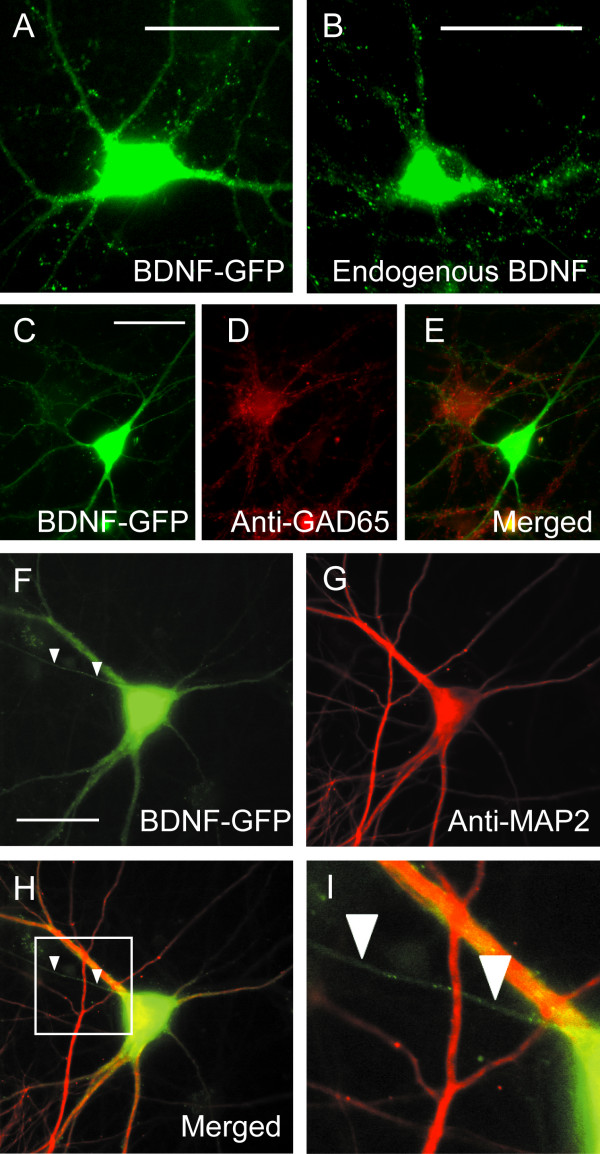
Background: Brain-derived neurotrophic factor (BDNF), which is sorted into a regulated secretory pathway of neurons, is supposed to act retrogradely through dendrites on presynaptic neurons or anterogradely through axons on postsynaptic neurons. Depending on which is the case, the pattern and direction of trafficking of BDNF in dendrites and axons are expected to be different. To address this issue, we analyzed movements of green fluorescent protein (GFP)-tagged BDNF in axons and dendrites of living cortical neurons by time-lapse imaging. In part of the experiments, the expression of BDNF tagged with cyan fluorescent protein (CFP) was compared with that of nerve growth factor (NGF) tagged with yellow fluorescent protein (YFP), to see whether fluorescent protein-tagged BDNF is expressed in a manner specific to this neurotrophin.

Results: We found that BDNF tagged with GFP or CFP was expressed in a punctated manner in dendrites and axons in about two-thirds of neurons into which plasmid cDNAs had been injected, while NGF tagged with GFP or YFP was diffusely expressed even in dendrites in about 70% of the plasmid-injected neurons. In neurons in which BDNF-GFP was expressed as vesicular puncta in axons, 59 and 23% of the puncta were moving rapidly in the anterograde and retrograde directions, respectively. On the other hand, 64% of BDNF-GFP puncta in dendrites did not move at all or fluttered back and forth within a short distance. The rest of the puncta in dendrites were moving relatively smoothly in either direction, but their mean velocity of transport, 0.47 +/- 0.23 (SD) microm/s, was slower than that of the moving puncta in axons (0.73 +/- 0.26 microm/s).

Conclusion: The present results show that the pattern and velocity of the trafficking of fluorescence protein-tagged BDNF are different between axons and dendrites, and suggest that the anterograde transport in axons may be the dominant stream of BDNF to release sites.


Figures

Figure 1
Figure 1
Similar distribution of BDNF-GFP and endogenous BDNF, and expression of BDNF-GFP in GAD65-negative neurons and its localization in axons and somatodendritic regions. A, BDNF-GFP expressed in a neuron 24 h after plasmid cDNA encoding BDNF-GFP was injected into the nucleus. Scale bar in A and B indicates 50 μm B, Immunocytochemical image of another, non-injected neuron stained with anti-BDNF antibody. C, Image of neurons expressing and not-expressing BDNF-GFP. Scale bar indicates 50 μm and applies to D and E. D, Image of the neurons shown in C, immunocytochemically stained with anti-GAD65 antibody. E, Superimposed images of C and D. F, Distribution of BDNF-GFP expressed in another neuron. Arrowheads indicate a MAP2-negative neurite. Scale bar indicates 50 μm and applies to G and H. G, Image of the same neuron as shown in F, immunocytochemically stained with anti-MAP2 antibody. H, Superimposed images of F and G. I, Magnified image of the boxed area in H. Vesicular puncta of BDNF-GFP in the axon are seen more clearly than those in H.
Figure 2
Figure 2
Simultaneous expression of BDNF-CFP and NGF-YFP in the same neuron and proportion of neurons with granular expression of fluorescent puncta. A, Image of a neuron expressing BDNF-CFP. Scale bar indicates 50 μm and applies to B and C. B, Image of the same neuron as in A, expressing NGF-YFP. C, Superimposed images of A and B. D, Proportion of neurons with granular expression of fluorescent puncta. Numerators at the right end of bar indicate the number of neurons showing granular expression of each neurotrophin tagged with CFP or YFP, and denominators indicate the total number of cells which expressed both fluorescent signals. E, Mean proportions of neurons with granular expression of fluorescent puncta, obtained from all the data including those obtained with the single injection of plasmid cDNAs. Numbers at the right end of bar indicate the number of injection trials, in which 4–10 neurons expressed fluorescent signals. Horizontal lines at the end of bars indicate 2SEMs.
Figure 3
Figure 3
Movements of BDNF-GFP puncta in an axon and dendrites of a living neuron. A, Image of a cortical neuron which expressed BDNF-GFP in soma, axon and dendrites. Time-lapse images in each square along an axon and a dendrite are magnified and shown in B and C, respectively. Scale bar, 50 μm. B, Moving (b and c) and non-moving (a) puncta in the axon. Each image was taken at a time point indicated at the top of each figure. Right is the distal side of the axon. Scale bar in the bottom image indicates 5 μm and applies to all the images in B and C. C, Moving (a and b) and non-moving (c) puncta in the dendrite. Right is the distal side of the dendrite. Each image was taken at a time point indicated at the top of each figure.
Figure 4
Figure 4
Properties of movement of BDNF-GFP puncta in axons and dendrites. A, A proportion of puncta which move in axons (filled columns) or dendrites (open columns) in the distal and proximal directions, do not move, and flutter within a small distance (10 μm). The numbers of puncta observed are given in parentheses. B, Distribution of moving puncta with different velocities. The bin width of the abscissa was 0.1 μm/s, and 0 indicates that the velocity was slower than 0.1 μm/s. The total numbers of vesicles analyzed were 132 in axons and 349 in dendrites. C, Cumulative plots of velocity distributions shown in the histograms of B. Dotted and continuous lines represent dendrites and axons, respectively.

Similar articles

Cited by

References

    1. Levi-Montalcini R. The nerve growth factor: thirty-five years later. EMBO J. 1987;6:1145–1154. - PMC - PubMed
    1. Chao MV. Neurotrophin receptors: A window into neuronal differentiation. Neuron. 1992;9:583–593. doi: 10.1016/0896-6273(92)90023-7. - DOI - PubMed
    1. Bibel M, Barde YA. Neurotrophins: key regulators of cell fate and cell shape in the vertebrate nervous system. Genes Dev. 2000;14:2920–2935. doi: 10.1101/gad.841400. - DOI - PubMed
    1. Huang EJ, Reichardt LF. Neurotrophins: Roles in neuronal development and function. Annu Rev Neurosci. 2001;24:677–736. doi: 10.1146/annurev.neuro.24.1.677. - DOI - PMC - PubMed
    1. Thoenen H. Neurotropins and neuronal plasticity. Science. 1995;270:593–598. - PubMed

Publication types

Substances

LinkOut - more resources