. 2005 Oct 15;106(8):2723-9.
doi: 10.1182/blood-2005-03-1290. Epub 2005 Jun 21.

Aggregometry detects platelet hyperreactivity in healthy individuals

Affiliations

Aggregometry detects platelet hyperreactivity in healthy individuals

Donald L Yee et al. Blood. .

Abstract

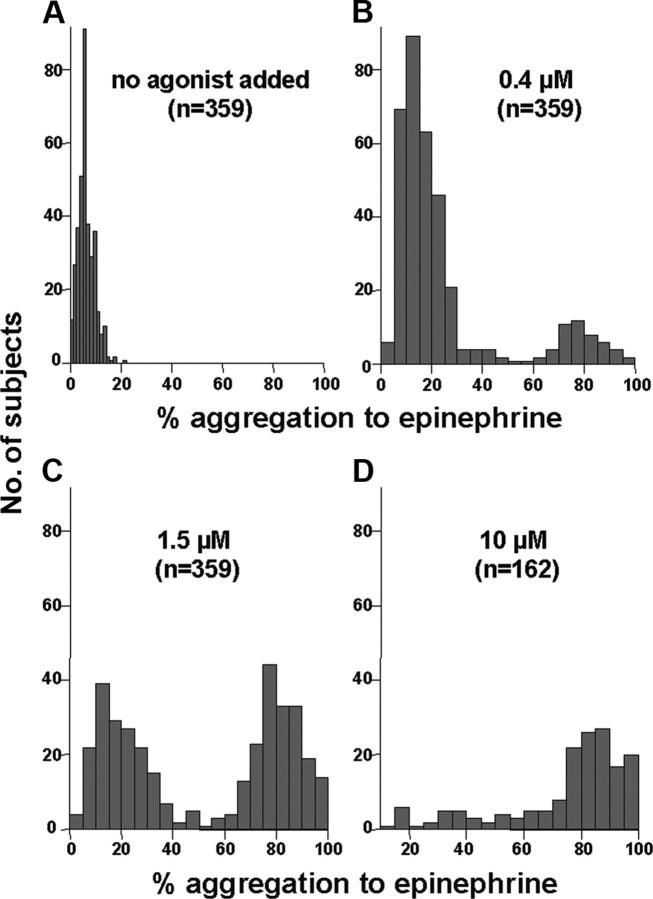
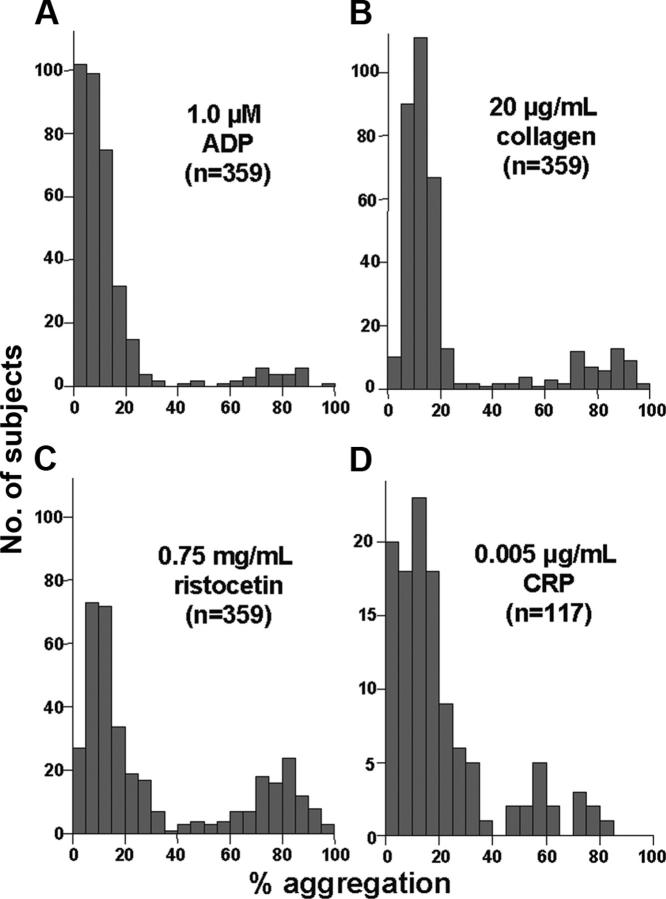
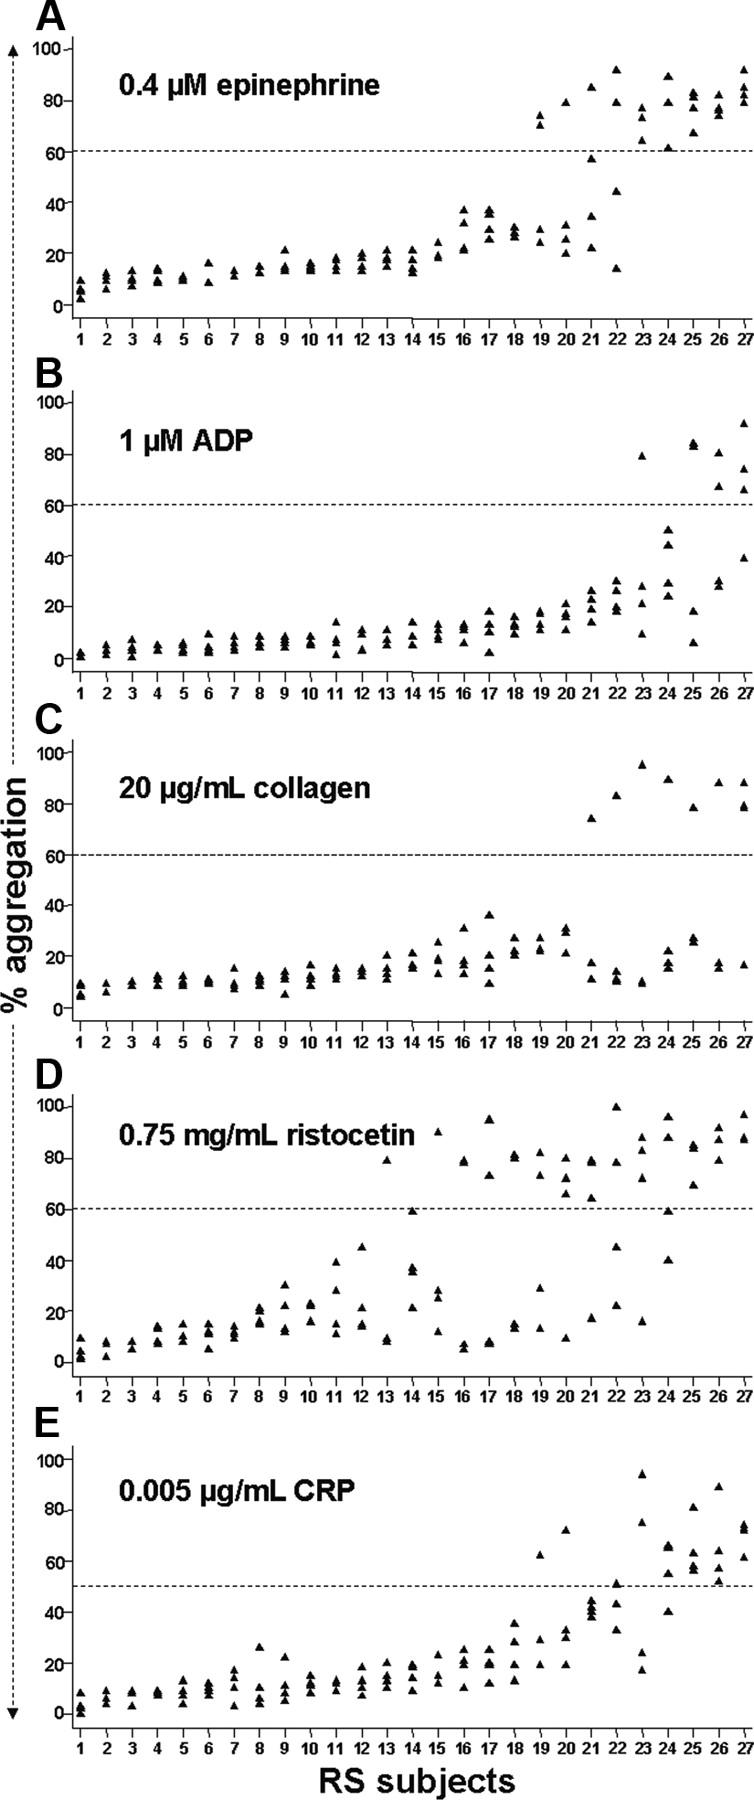
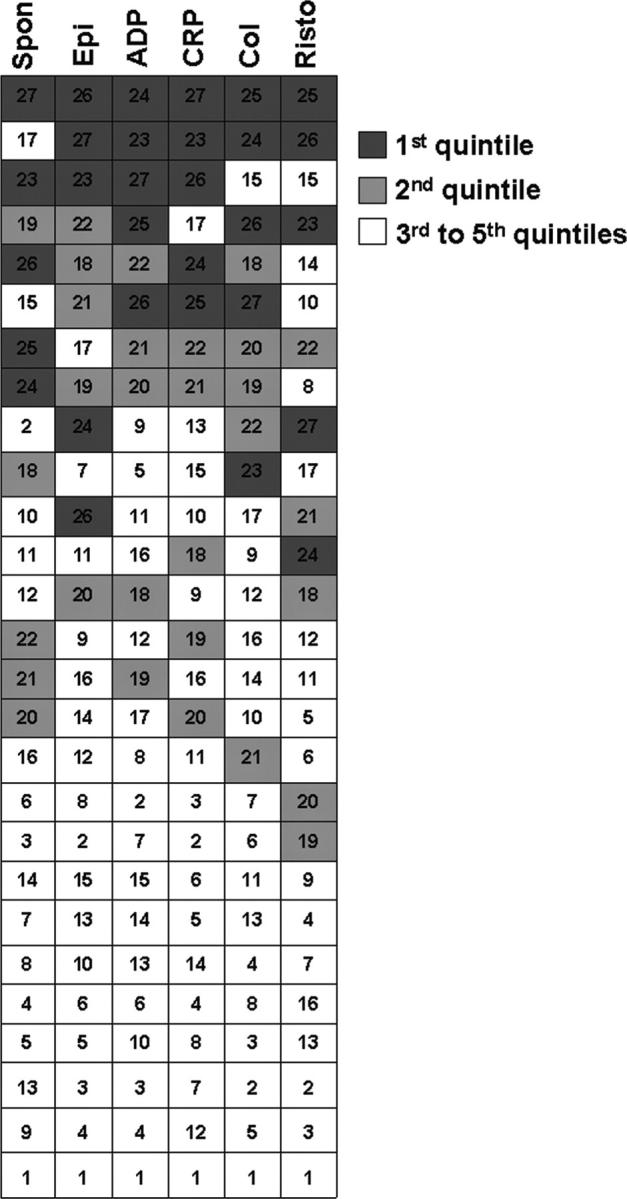
Aggregometry is widely used to assess platelet function, but its use in identifying platelet hyperreactivity is poorly defined. We studied platelet aggregation in 359 healthy individuals using the agonists adenosine diphosphate (ADP), epinephrine, collagen, collagen-related peptide, and ristocetin. We also assessed the reproducibility of these assays in 27 subjects by studying them repeatedly on at least 4 separate occasions. Healthy subjects exhibited considerable interindividual variability in aggregation response to agonists, especially at concentrations lower than those typically used in clinical laboratories. For each agonist tested at these submaximal concentrations, a small proportion of individuals demonstrated an unusually robust aggregation response. Subjects who exhibited such in vitro hyperreactivity to one agonist tended to demonstrate a similar response to others, suggesting that hyperreactivity is a global characteristic of platelets. Epinephrine and collagen-related peptide were especially reliable and efficient in detecting hyperreactivity. For epinephrine, excellent reproducibility persisted for up to 3 years, and hyperreactivity was associated with female sex and higher fibrinogen levels (P < .02). We recommend these assays as appropriate candidates for future studies requiring accurate assessment of increased platelet reactivity. These include clinical studies to improve risk assessment for arterial thrombosis, as well as genetic studies to establish determinants of the hyperreactive platelet phenotype.


Figures

Figure 1.
Figure 1.
Distribution of aggregation response to increasing epinephrine concentrations among healthy individuals. These histograms depict the number of subjects (y-axis) with a given level of platelet aggregation (x-axis) to no agonist (A) and epinephrine at concentrations of 0.4 μM (B), 1.5 μM (C), and 10 μM (D). Panel D shows fewer subjects because specimens were not tested at higher concentrations if more than 60% aggregation was observed at lower concentrations.
Figure 2.
Figure 2.
Distribution of aggregation response to submaximal agonist concentrations. These histograms depict the number of subjects (y-axis) with a given level of platelet aggregation (x-axis) to the indicated agonists. Seven percent, 15%, and 26% of subjects exhibited more than 60% aggregation in response to 1 μM ADP (A), 20 μg/mL collagen (B), and 0.75 mg/mL ristocetin (C), respectively. The histogram for 0.005 μg/mL CRP (D) differed slightly, with a small peak of responses just below 60% (13% of subjects showed > 50% aggregation), perhaps due to a smaller number of subjects.
Figure 3.
Figure 3.
Scatter plots of reproducibility data at submaximal agonist concentrations. For each assay depicted, the extent of aggregation (y-axis) exhibited during each of the 27 subjects' 4 assay runs is shown. Subject numbering (x-axis) in each panel is ordered from the lowest to highest mean percent aggregation for that particular assay and does not correspond with numbering in other panels. The appearance of fewer than 4 data points is due to superimposed values. Dashed lines represent cutoffs for classifying relative platelet hyperreactivity for each assay.
Figure 4.
Figure 4.
Reproducibility of relative hyperreactivity to epinephrine over months to years. Fifteen subjects in the reproducibility study had had PRP aggregometry at 0.4 μM epinephrine performed in the past. The older data are shown as open triangles and plotted on the corresponding scatter plot from Figure 3A (same subject numbering). Values above/below the data points indicate the number of months (mean = 19 months) elapsed between the first result and subsequent (RS) results.
Figure 5.
Figure 5.
Correlation of extent of platelet reactivity among different agonists. Each of the 27 rows of boxes represents one subject in the reproducibility study. Data from each of 4 runs of each assay were averaged for spontaneous aggregation (Spon) and aggregation to 0.4 μM epinephrine (Epi), 1.0 μM ADP, 0.005 μg/mL CRP, 20 μg/mL collagen (Col), and 0.75 mg/mL ristocetin (Risto). For each assay, subjects were ranked according to average aggregation (1 = lowest, 27 = highest). Boxes are shaded according to ranking by quintiles for each assay (eg, subjects who were ranked 23-27 fell into the top quintile and are marked in dark gray). The number in each box of a given row represents the rank for that subject on a specific assay.

References

    1. Refaai MA, Laposata M. Platelet aggregation. In: Michelson AD, ed. Platelets. San Diego, CA: Academic Press; 2002: 291-296.
    1. Coller BS. Platelet aggregation by ADP, collagen, and ristocetin: a critical review of methodology and analysis. In: Schmidt RM, ed. CRC Handbook Series in Clinical Laboratory Science. Section I. Boca Raton, FL: CRC Press; 1979: 381-396.
    1. Sixma JJ. Methods for platelet aggregation. In: Mannucci PM, Gorini S, eds. Platelet Function and Thrombosis. Vol 34. New York, NY: Plenum Press; 1972: 79-96. - PubMed
    1. Tiffany ML. Technical considerations for platelet aggregation and related problems. Crit Rev Clin Lab Sci. 1983;19: 27-69. - PubMed
    1. George JN, Caen JP, Nurden AT. Glanzmann's thrombasthenia: the spectrum of clinical disease. Blood. 1990;75: 1383-1395. - PubMed

Publication types