Comparative Study
. 2005 Sep;171(1):227-38.
doi: 10.1534/genetics.105.042051. Epub 2005 Jun 21.

A genetic linkage map for the tiger pufferfish, Takifugu rubripes

Affiliations
Comparative Study

A genetic linkage map for the tiger pufferfish, Takifugu rubripes

Wataru Kai et al. Genetics. 2005 Sep.

Abstract

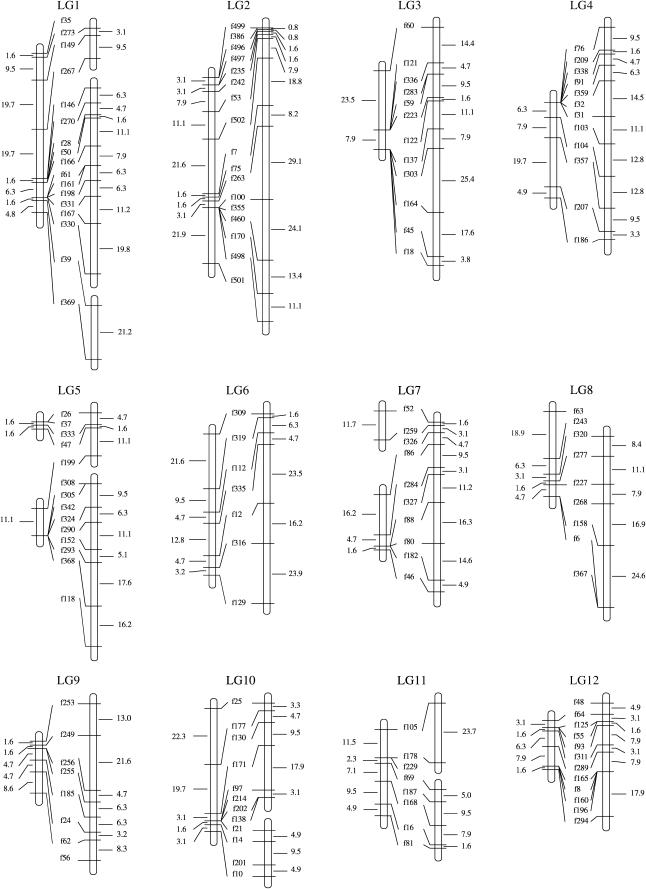
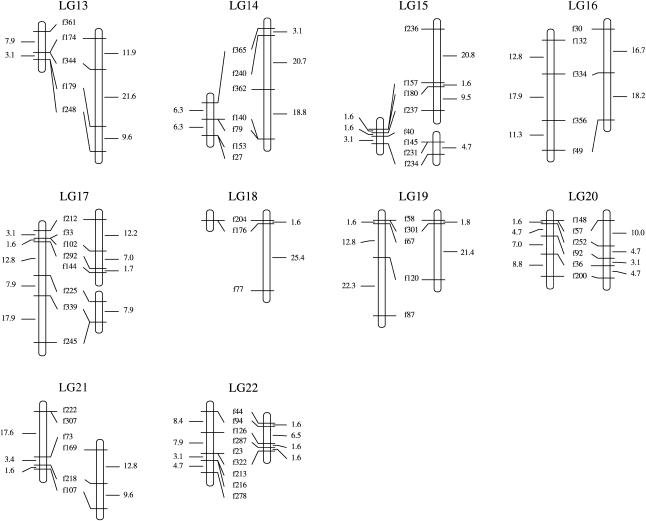
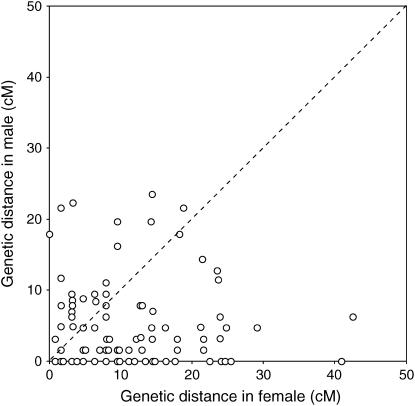
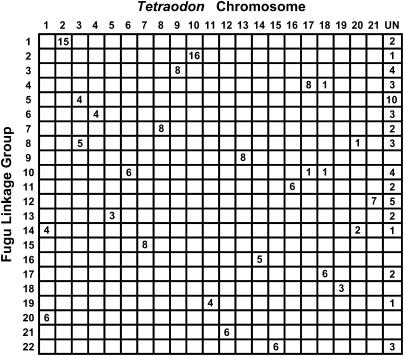
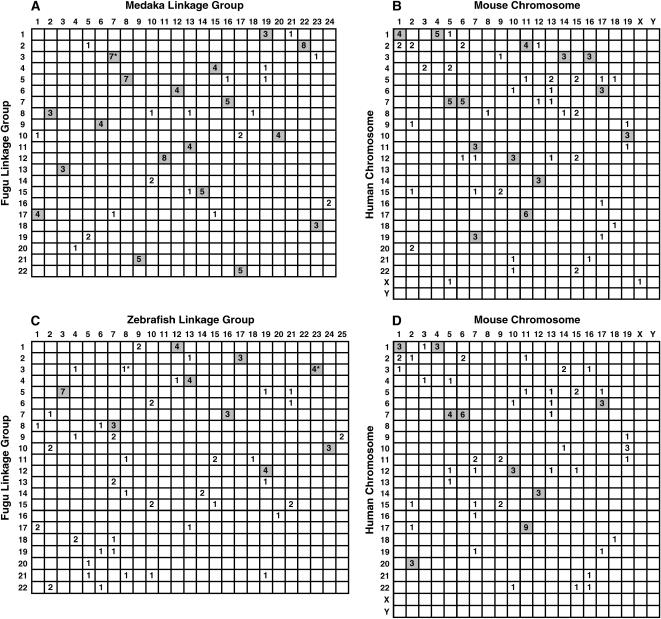
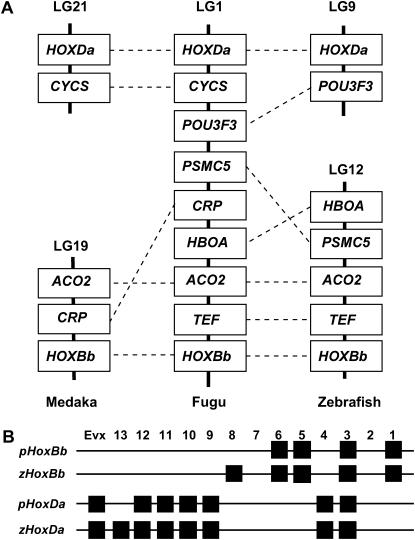
The compact genome of the tiger pufferfish, Takifugu rubripes (fugu), has been sequenced to the "draft" level and annotated to identify all the genes. However, the assembly of the draft genome sequence is highly fragmented due to the lack of a genetic or a physical map. To determine the long-range linkage relationship of the sequences, we have constructed the first genetic linkage map for fugu. The maps for the male and female spanning 697.1 and 1213.5 cM, respectively, were arranged into 22 linkage groups by markers heterozygous in both parents. The resulting map consists of 200 microsatellite loci physically linked to genome sequences spanning approximately 39 Mb in total. Comparisons of the genome maps of fugu, other teleosts, and mammals suggest that syntenic relationship is more conserved in the teleost lineage than in the mammalian lineage. Map comparisons also show a pufferfish lineage-specific rearrangement of the genome resulting in colocalization of two Hox gene clusters in one linkage group. This map provides a foundation for development of a complete physical map, a basis for comparison of long-range linkage of genes with other vertebrates, and a resource for mapping loci responsible for phenotypic differences among Takifugu species.


Figures

Figure 1.
Figure 1.
Male and female genetic linkage maps of fugu. Allelic bridges are indicated by lines connecting male (left) and female (right) linkage maps. Genetic distances between adjacent markers are shown (Kosambi mapping function).
Figure 1.
Figure 1.
Male and female genetic linkage maps of fugu. Allelic bridges are indicated by lines connecting male (left) and female (right) linkage maps. Genetic distances between adjacent markers are shown (Kosambi mapping function).
Figure 2.
Figure 2.
Differences in recombination ratio between male and female. The common intervals flanked by adjacent markers from the 22 linkage groups are compared.
Figure 3.
Figure 3.
Summary of the number of orthologous genome regions in fugu and T. nigroviridis. The linkage groups of fugu are arrayed as columns and the chromosomes of Tetraodon as rows. Genome sequences that have not been mapped in Tetraodon are displayed in the last row (UN, unknown). Numbers in boxes indicate the number of orthologous genome sequences. Details of mapped sequences are listed in supplementary Table S2 at http://www.genetics.org/supplemental/.
Figure 4.
Figure 4.
Conservation of synteny among fugu, medaka, zebrafish, human, and mouse. The putative orthologous genes from two species are arrayed according to linkage group or chromosome for each species. Numbers in boxes indicate the number of orthologous gene pairs. The boxes containing more than three orthologous gene pairs are shaded. (A) Fugu-medaka comparison; (B) human-mouse comparison based on genes orthologous to data set in A; (C) fugu-zebrafish comparison; (D) human-mouse comparison based on genes orthologous to data set in C. (*) Three of the orthologs in comparisons between A and B and two of the orthologs in comparisons between C and D, respectively, have been excluded as we failed to identify their mouse orthologs. Details of the orthologous genes are listed in supplementary Table S2 at http://www.genetics.org/supplemental/.
Figure 5.
Figure 5.
(A) Comparative linkage map of HoxBb and HoxDa clusters and their flanking regions in fugu, medaka, and zebrafish. Genes are named according to the nomenclature for the orthologous genes of human or zebrafish. The zebrafish and medaka genes for which there is no mapping information are not shown in the linkage map. Orthologous genes are linked by dashed lines. (B) Genomic organization of HoxBb and HoxDa clusters in pufferfishes (fugu, Tetraodon, and Spheroides) (p) and zebrafish (z). Hox paralog group is shown along the top.

References

    1. Amores, A., A. Force, Y. L. Yan, L. Joly, C. Amemiya et al., 1998. Zebrafish hox clusters and vertebrate genome evolution. Science 282: 1711–1714. - PubMed
    1. Amores, A., T. Suzuki, Y. L. Yan, J. Pomeroy, A. Singer et al., 2004. Developmental roles of pufferfish Hox clusters and genome evolution in ray-fin fish. Genome Res. 14: 1–10. - PMC - PubMed
    1. Aparicio, S., J. Chapman, E. Stupka, N. Putnam, J. M. Chia et al., 2002. Whole-genome shotgun assembly and analysis of the genome of Fugu rubripes. Science 297: 1301–1310. - PubMed
    1. Asahida, T., T. Kobayashi, K. Saitoh and I. Nakayama, 1996. Tissue preservation and total DNA extraction from fish stored at ambient temperature using buffers containing high concentration of urea. Fish. Sci. 62: 727–730.
    1. Bourque, G., P. A. Pevzner and G. Tesler, 2004. Reconstructing the genomic architecture of ancestral mammals: lessons from human, mouse, and rat genomes. Genome Res. 14: 507–516. - PMC - PubMed

Publication types

MeSH terms