

Eutrophication of aquatic ecosystems: bistability and soil phosphorus
- PMID: 15972805
- PMCID: PMC1177388
- DOI: 10.1073/pnas.0503959102
Eutrophication of aquatic ecosystems: bistability and soil phosphorus
Abstract
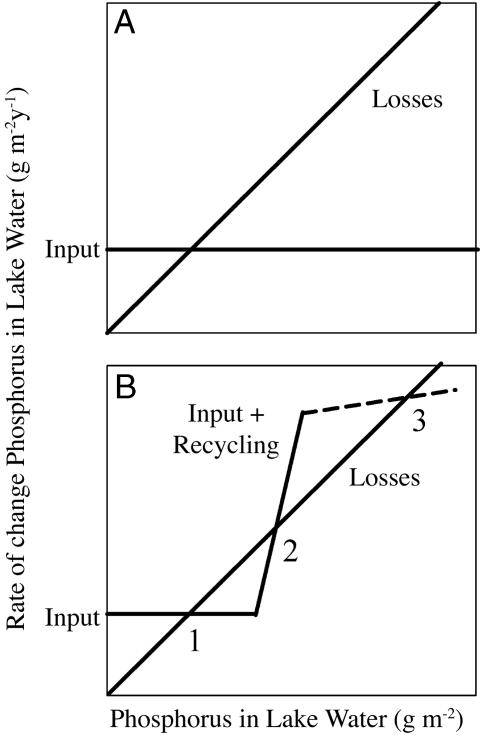
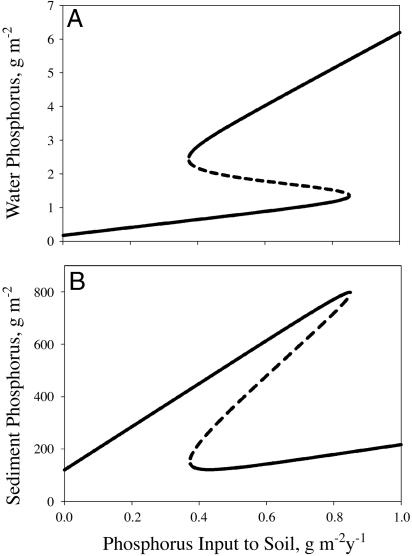
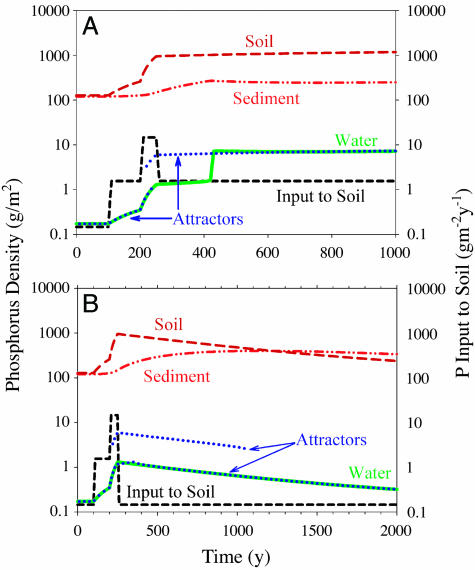
Eutrophication (the overenrichment of aquatic ecosystems with nutrients leading to algal blooms and anoxic events) is a persistent condition of surface waters and a widespread environmental problem. Some lakes have recovered after sources of nutrients were reduced. In others, recycling of phosphorus from sediments enriched by years of high nutrient inputs causes lakes to remain eutrophic even after external inputs of phosphorus are decreased. Slow flux of phosphorus from overfertilized soils may be even more important for maintaining eutrophication of lakes in agricultural regions. This type of eutrophication is not reversible unless there are substantial changes in soil management. Technologies for rapidly reducing phosphorus content of overenriched soils, or reducing erosion rates, are needed to improve water quality.
Figures
References
-
- Smith, V. H. (1998) in Successes, Limitations & Frontiers of Ecosystem Science, eds. Pace, M. L. & Groffman, P. (Springer, New York), pp. 7-49.
-
- Schindler, D. W. (2005) Limnol. Oceanogr., in press.
-
- Wilson, M. A. & Carpenter, S. R. (1999) Ecol. Appl. 9, 772-783.
-
- Millennium Ecosystem Assessment (2005) Synthesis Report (Island, Washington, DC), www.MAweb.org.
-
- Schindler, D. W. (1977) Science 195, 260-262. - PubMed
Publication types
MeSH terms
Substances
LinkOut - more resources
Full Text Sources
Other Literature Sources
