

Comparative Study
doi: 10.1073/pnas.0503952102.
Epub 2005 Jun 22.
Regulating the proton budget of higher plant photosynthesis
Affiliations
- PMID: 15972806
- PMCID: PMC1172270
- DOI: 10.1073/pnas.0503952102
Item in Clipboard
Comparative Study
Regulating the proton budget of higher plant photosynthesis
Proc Natl Acad Sci U S A.
.
Abstract
In higher plant chloroplasts, transthylakoid proton motive force serves both to drive the synthesis of ATP and to regulate light capture by the photosynthetic antenna to prevent photodamage. In vivo probes of the proton circuit in wild-type and a mutant strain of Arabidopsis thaliana show that regulation of light capture is modulated primarily by altering the resistance of proton efflux from the thylakoid lumen, whereas modulation of proton influx through cyclic electron flow around photosystem I is suggested to play a role in regulating the ATP/NADPH output ratio of the light reactions.
Figures
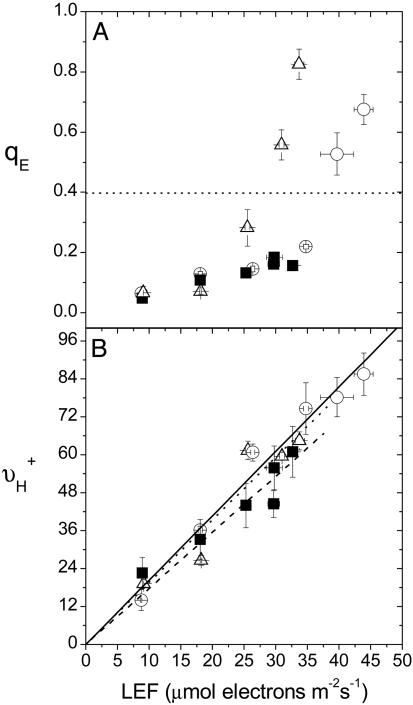
LEF dependencies of antenna regulation and light-driven proton flux across the thylakoid membrane. Chlorophyll a fluorescence yield and ECS analyses were used to obtain estimates of energy-dependent exciton quenching (qE)(A) and steady-state proton flux into the lumen (νH+) (B), respectively, from 26 to 216 μmol photons m-2s-1 on leaves from A. thaliana Wt under ambient (372 ppm CO2/21% O2) (○) and low CO2 (LC; 50 ppm CO2/21% O2) (▵) air, as well as pgr5 under ambient air (▪) and plotted as a function of estimated LEF (18). Linear regressions of LEF versus νH+ are shown in B, the regression slopes of which are 2.035 (solid line), 2.038 (dotted line), and 1.774 (dashed line) for Wt ambient air, Wt/LC air, and pgr5 ambient air, respectively. Slopes for Wt/atmospheric and pgr5/atmospheric were judged by analysis of covariance to be statistically different (P < 0.05). Error bars represent SE for n = 3–6.
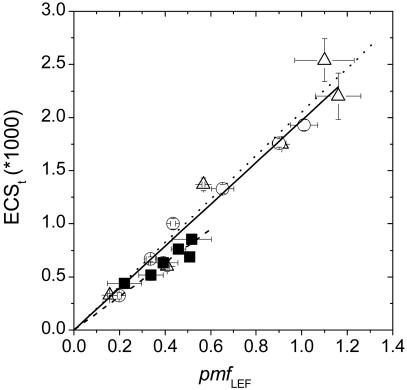
The relationship between light-induced pmf and the pmf generated by LEF alone. ECS and chlorophyll a fluorescence yield analyses were performed on leaves from A. thaliana Wt plants and pgr5 to estimate light-induced pmf (ECSt) and LEF, respectively, from which estimates of the pmf generated by LEF alone (pmfLEF) were obtained (i.e., pmfLEF = LEF/gH+). Linear regressions of pmfLEF versus ECSt are shown, the slopes of which are 1.972 (solid line), 2.053 (dotted line), and 1.701 (dashed line) for Wt/ambient air, Wt/LC air, and pgr5/ambient air, respectively. Slopes for Wt/atmospheric and pgr5/atmospheric were ≈14% different and judged by analysis of covariance to be statistically different (P < 0.05). The small difference (≈4%) between the slopes of Wt/atmospheric versus Wt/LC was not statistically significant (P = 0.6). Conditions and symbols are as in Fig. 1. Error bars represent SE for n = 3–6.
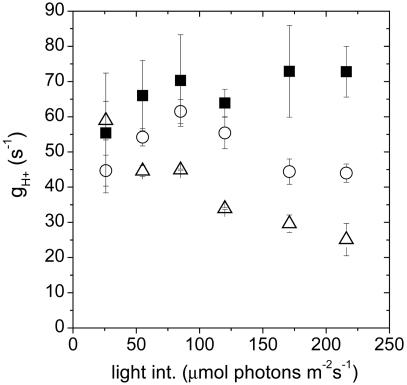
The light intensity dependence of the proton conductivity of the ATP synthase (gH+). Estimates of gH+ in Wt and pgr5 from 26 to 216 μmol photons m-2s-1 were obtained by taking the inverse of the time constant for ECS decay during a 300-ms dark perturbation of steady-state conditions. Conditions and symbols are as in Fig. 1. Error bars represent SE for n = 3–6.
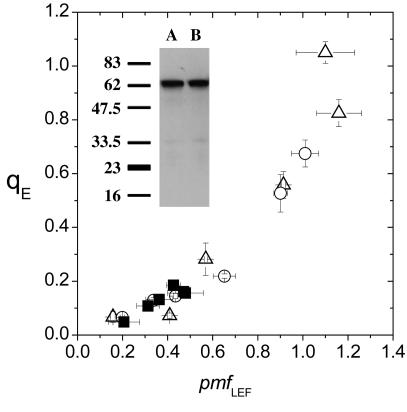
The relationship between energy-dependent exciton quenching and the pmf generated solely by LEF. Estimates of energy-dependent quenching (qE) and the pmf generated solely by LEF (i.e., pmfLEF) were obtained as in Figs. 1 and 2, respectively. ATP synthase content in Wt (A) and pgr5 (B) was estimated by Western blot analyses by using polyclonal serum directed against the β-subunit of the ATP synthase (Inset). Conditions and symbols are as in Fig. 1. Error bars represent SE for n = 3–6.
References
-
- Ort, D. R. & Yocum, C. F. (1996) in Oxygenic Photosynthesis: The Light Reactions, ed. Yocum, C. F. (Kluwe, Dordrecht, The Netherlands), pp. 1-9.
-
- Kramer, D. M., Cruz, J. A. & Kanazawa, A. (2003) Trends Plant Sci. 8, 27-32. - PubMed
-
- Cruz, J. A., Sacksteder, C. A., Kanazawa, A. & Kramer, D. M. (2001) Biochemistry 40, 1226-1237. - PubMed
-
- Kramer, D., Sacksteder, C. & Cruz, J. (1999) Photosynth. Res. 60, 151-163.
-
- Capaldi, R. A. & Aggeler, R. (2002) Trends in Biochem. Sci. 27, 154-160. - PubMed
Publication types
MeSH terms
Substances
LinkOut - more resources
Full Text Sources
Other Literature Sources
